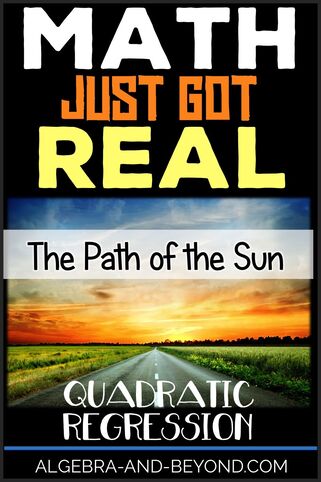 
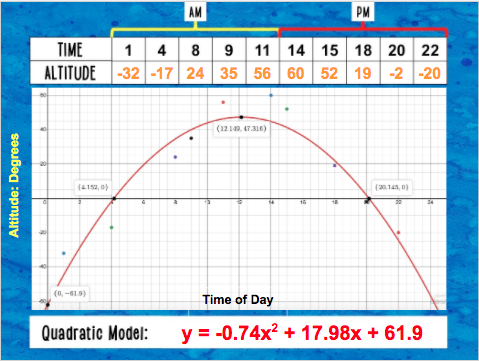
Using data to find a quadratic graph of best fit is an awesome way to connect math with the real world. However, it’s not always easy to find authentic data to use for a quadratic regression equation. I REALLY wanted to use the flight of a soccer ball or golf ball and find a video on YouTube that had all the stats using a trace finder that states the distance and height. I searched and searched, but could not find a video that was clear and had the information needed to collect data for a scatter plot. So, I began looking at weather patterns, but that wasn’t quite right either. However, it helped me stumble across the timeanddate.com site. This is when I realized I can use the time of day and the altitude of the sun for a quadratic regression real world project! Of course, you can only use it for ONE day otherwise, it’s a periodic function. Here are the details of the project...

OBJECTIVE
In this project, students are to find the curve of best fit for a quadratic function in the real world by performing the following:
VISUALS The Google Slides template is provided, so students can type in their information in the specific location. They then can easily turn their project into you via Google Classroom or email.
The project directions and rubric are 100% editable! This is very easy to integrate into any Algebra course either in-person or online, gives students some freedom of what place to research, and is mathtastically fun! And since it’s editable, you can even change it to record data over several days and find the sinusoidal regression equation for a higher-level math course.
Click on the cover below to go directly to this project: 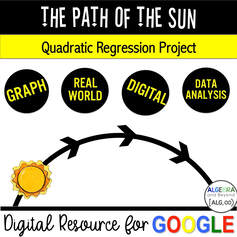
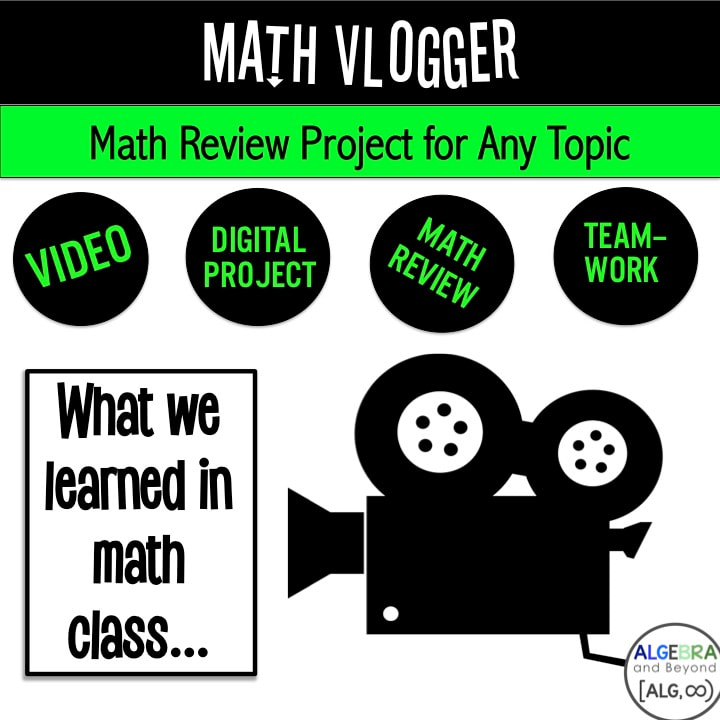
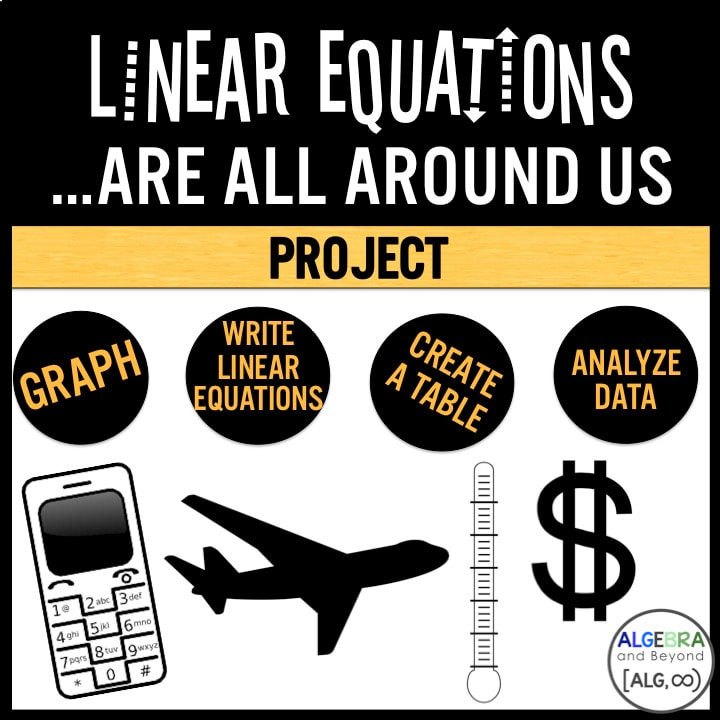
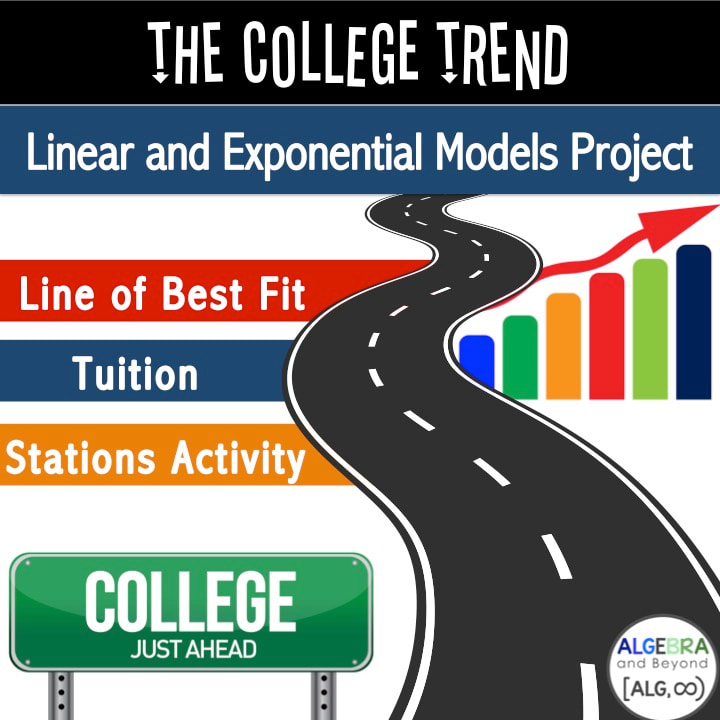
Other projects you may like:
Don't forget to join the Algebra and Beyond Community!
0 Comments
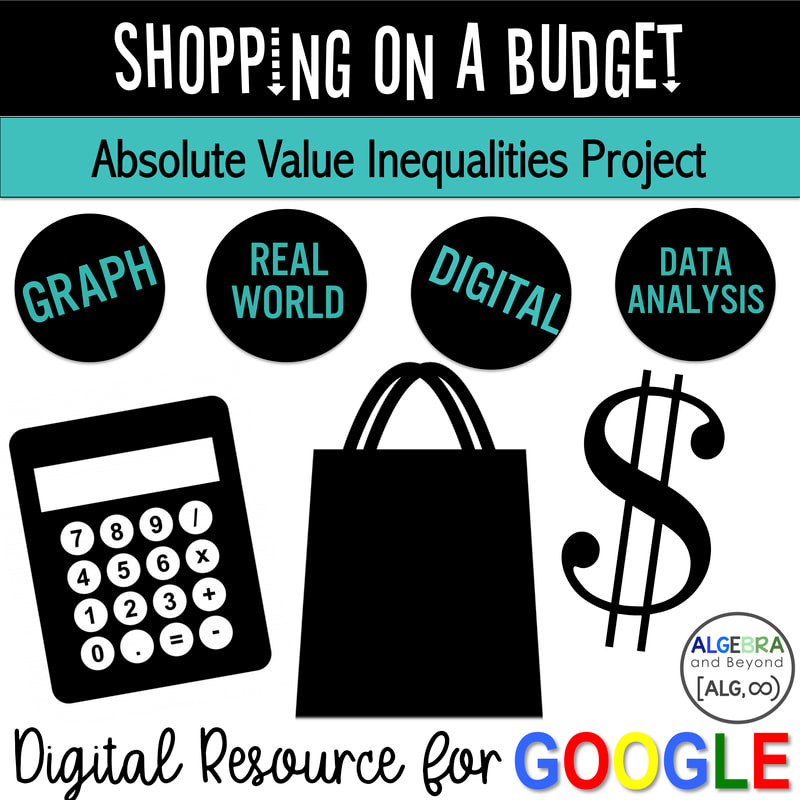
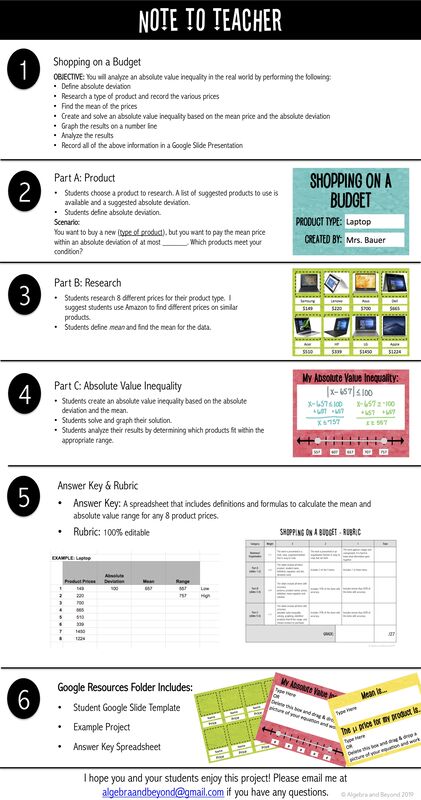
 Absolute value inequalities was not a topic my Algebra 2 students remembered from Algebra 1 AT ALL! I know that they hadn’t seen it in two years, but still, I felt like it was a completely brand new topic for them. This got me thinking that I need to have an absolute value inequalities project in Algebra 1 to help solidify this concept long term. So, I did some research on the Internet to find some ideas on a fun way to tackle this concept. I created the following project and my students had a lot of fun with it because it combines technology, shopping (who doesn’t love to shop?!), and of course math. Below is an overview of this project…  SHOPPING ON A BUDGET OBJECTIVE Every project needs to have a focus and goal. In this project, students are to…
GRADING As with any project, I do use a rubric, which is 100% editable for teachers. I also include a Google Sheet where you can type in each student’s product price and it will calculate the mean and deviation range, so you can easily check each project. I dread grading projects, as they can take a long time, but this rubric and spreadsheet make it so simple and fast! This project is very easy to integrate into any Algebra course, gives students some freedom of what product to research, and is mathtastically fun! Here is a video that shows the example project I show my students before they begin: Click on the cover below to go directly to this project: 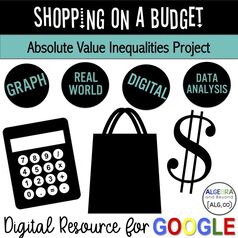 More mathtastic real world projects for you and your students:
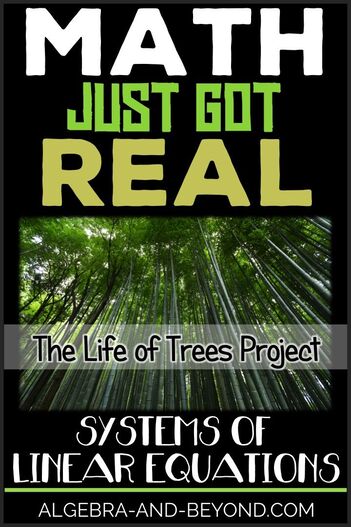
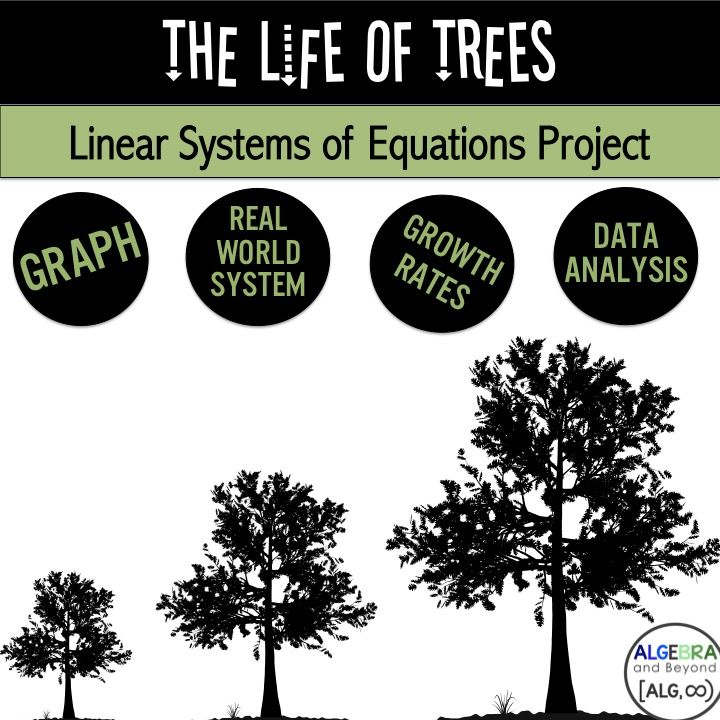
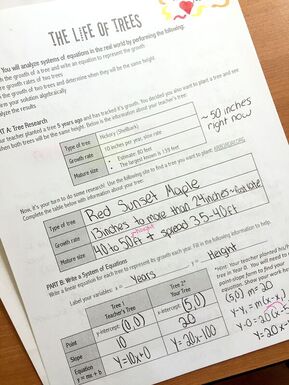
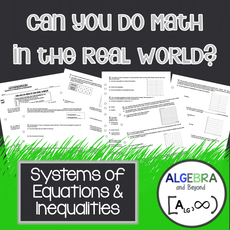
I am always trying to create or find projects where each student’s project will be different than every other student’s in the class because it is more authentic this way. And of course, I want it to be applicable in the real world! This is not always easy to make because if every student’s project is different, or even has an unlimited number of solutions, checking each one is extremely difficult and time-consuming for the teacher. Well, guess what?!...the project I’m about to tell you about is authentic AND I was able figure out how each student could have a different solution. And at the same time, have an answer key for the teacher with all the possible solutions….I know, fabulous, right!! And it covers one of the most popular math topics…Linear Systems of Equations!
Oh wait, one more cool thing about it….it’s not quite STEM because there isn’t any engineering, but I’d say it’s STAM (Science, Technology, Art, and Math)…fun little twist…so check it out: 
OBJECTIVE
Every project needs to have a focus and goal. In this project, students are to…
RESEARCH & SOLUTIONS
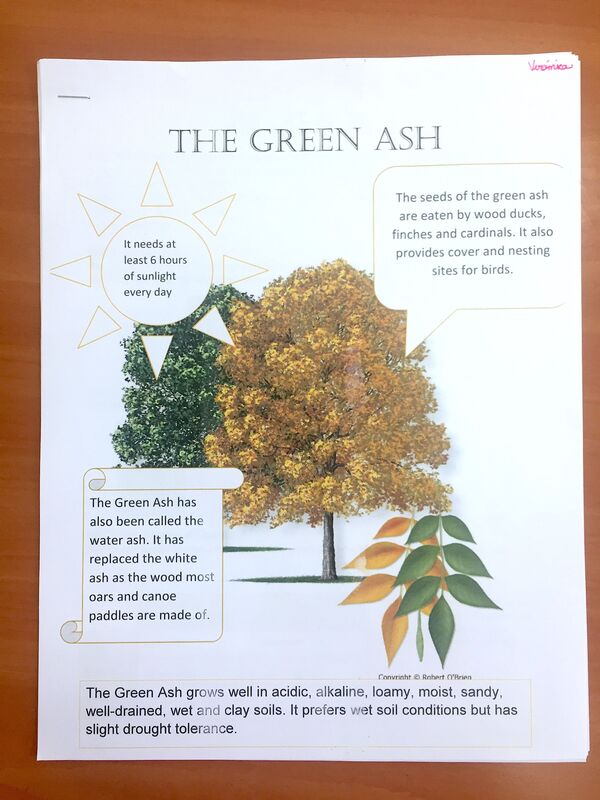
Students select a tree from the Arbor Day site and find the growth rate range and mature size. Students write two equations – 1 to represent their tree’s growth over time and 2 - their teacher’s tree growth over time. Students use the substitution or elimination method to solve the system and explain the solution. Included is a spreadsheet where the teacher can record the student name, tree, and growth rate to ensure each student has a different growth rate.
VISUALS
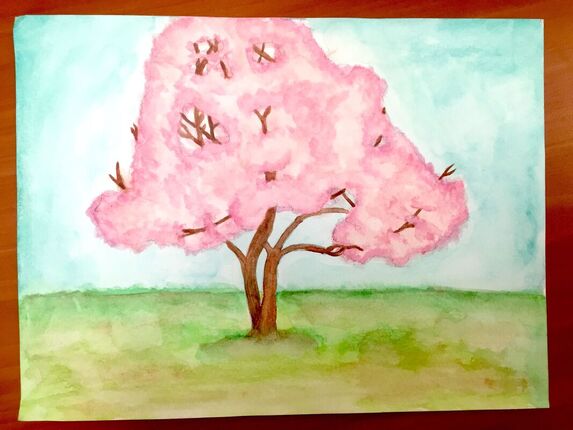
Student’s us graph paper or Desmos to re-create their system of linear equations by graphing both lines. Students also draw, paint, or find a picture of their tree online and label it by finding specific characteristics of their tree. I learn a lot of neat things about different trees from each project. And students love the artsy aspect!
RESULTS
Students find at what year the trees are the same height and determine if it’s realistic based on the year each tree will reach their mature size. This helps students understand that not every solution in the real world will make sense, so it’s important to critically think about the results.
GRADING
As with any project, I do use a rubric, which is 100% editable for teachers. This project is evaluated on the following criteria: neatness/organization, accurate research, writing a systems of equations and finding the correct solution, the graph, analyzing the results, and the visuals. I also include an answer key for the questions and all of the possible scenarios/solutions depending on the growth rate of each tree in comparison with the growth rate of the teacher’s tree. This is a HUGE time saver for teachers!
This project is very dynamic, creative, and fun! Here are some of my student’s Life of Trees Projects: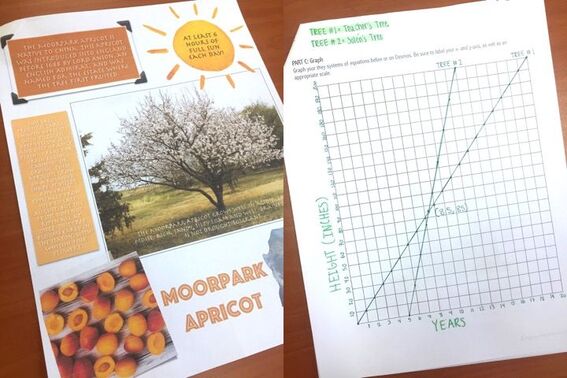
Click on the Life of Trees Project cover below to go directly to the resource. Look at the preview to learn even more about this activity!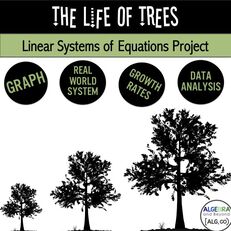
Here are more resources for systems of equations:
Want to join the Algebra and Beyond mailing list to have instant access to fun and engaging resources?!
If you were to visit my classroom, you would see a lot of different ways students learn: guided notes, games, stations, activities, projects and more! Project Based Learning (PBL) is a great way for students to critically think, problem solve, and, in general, see math differently. Therefore, I try to integrate a project into every unit and make them as “real” as possible.
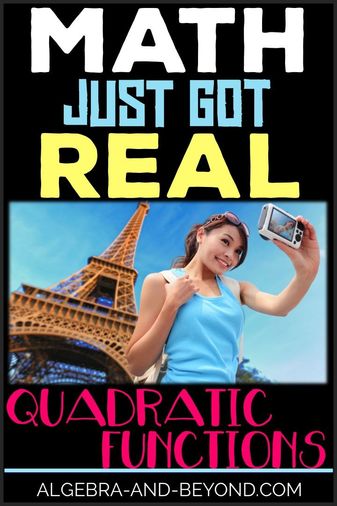
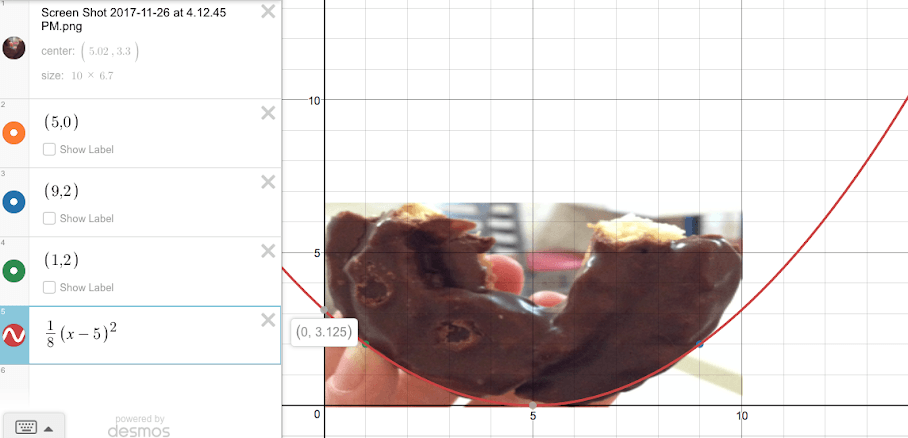
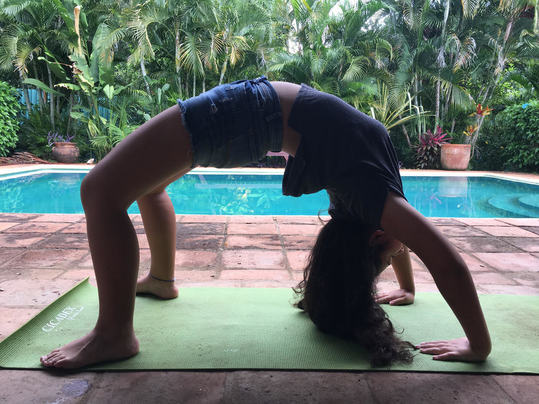
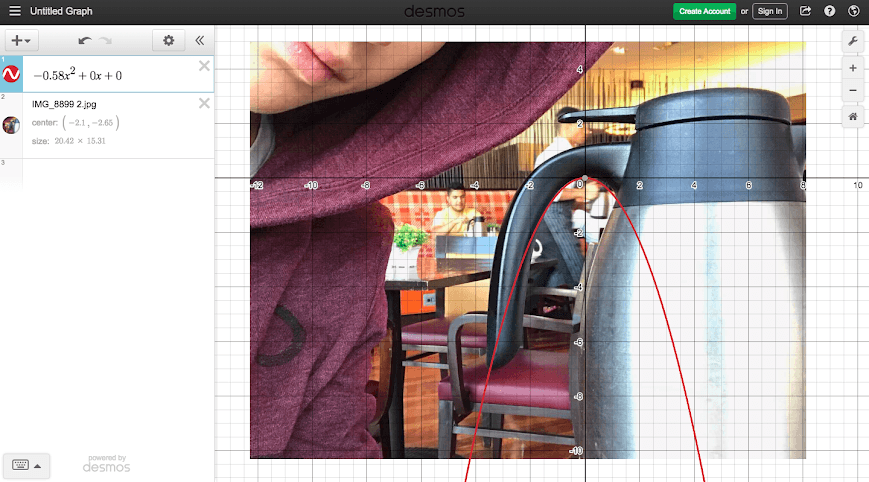
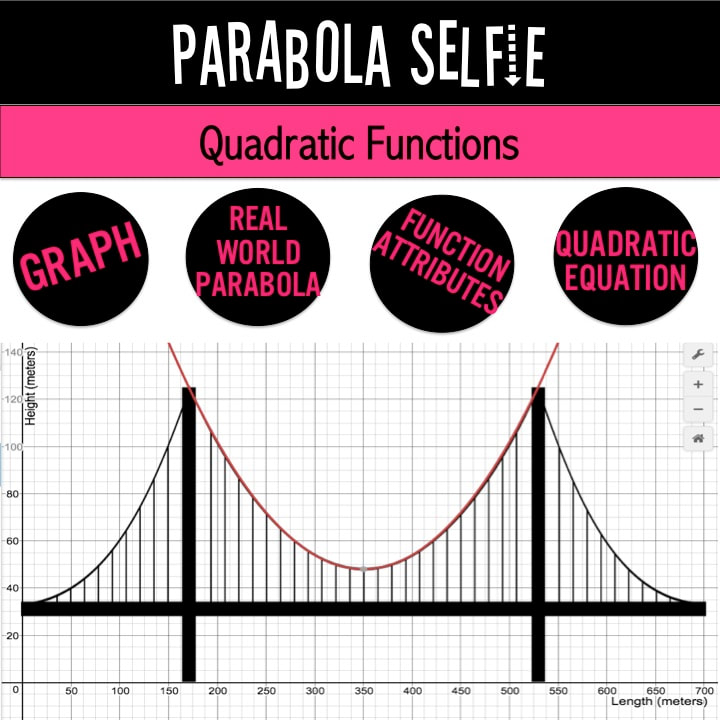
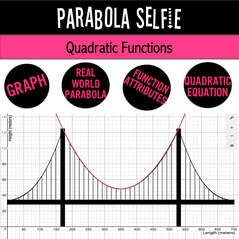
One of my favorites, and my students, is the Parabola Selfie Project. In this project, students take math outside of the classroom and explore the real world to find a parabola. Let’s take a quick look at how this project is broken down… 
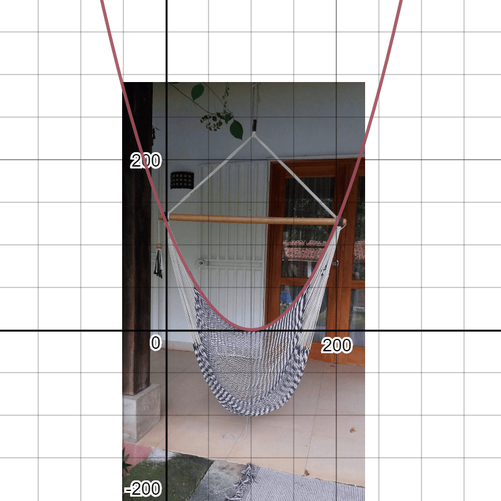
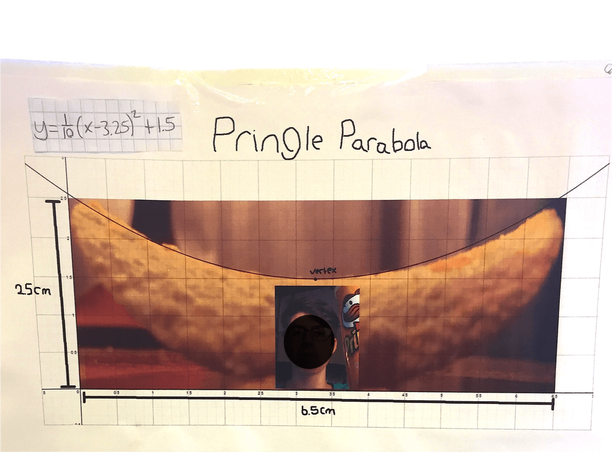
THE SELFIE
Students find a parabola in the real world and then take a selfie with it. Why take a selfie, you say? Well, first of all, it makes it fun for them since selfies are something they do often and share on Facebook, Snapchat, Instagram, or some other form of social media. Second, I want to make sure they don’t just Google search a picture online. That would take all of the fun out of this project. There is so much in the world to investigate, so I want them to go out there and see math as much as possible.
THE GRAPH
Next we pop that picture right into Desmos, which is an online graphing calculator. Students adjust the scale of the graph to match the dimensions of the real life parabola. I’ve even created a video showing students how to do this, in case they are not familiar with Desmos. Then they write an equation for their parabola and analyze the parabola by finding characteristics such as the axis of symmetry, vertex, domain, range, etc.
PEER REVIEW
In almost every project I try to create a fun little twist that involves students observing or reviewing each other’s project. In this one, I have students exchange their graphs with each other and use the Parabola Swap table to record their information. This will give students an opportunity to identify characteristics of another parabola and also receive feedback on the accuracy of their data.
THE PRESENTATION
I rarely have students complete a project and then individually present to the class. It takes up too much class time and sometimes it can be difficult to see and understand the data when in a slideshow. I’d rather students take their information and put it on a poster or in a report format. Then we do some kind of walk around to view all the projects up close.
For this project, since students already swapped parabola graphs with another group and filled out the characteristics table for that graph, I don’t have them fill out another form when they do the walk around. Instead, I have them view each project and then vote on who found the most unique parabola in the real world. I give out a prize to the first and second place winners. You could give out a homework pass, food, or anything that your students enjoy. This gives each student a little more incentive to really find a fun and unique parabola. GRADING
As with any project, I do use a rubric. I evaluate each project on the following criteria: neatness/organization, the parabola selfie, the graph, the characteristics of the graph, and the quadratic equation.
Here are some of my student’s Parabola Selfies:
Doesn’t the Parabola Selfie Project look like fun?!....and educational! Click on the project below that you'd like to try in your classroom:
Want to join the Algebra and Beyond mailing list to have instant access to fun and engaging resources?!
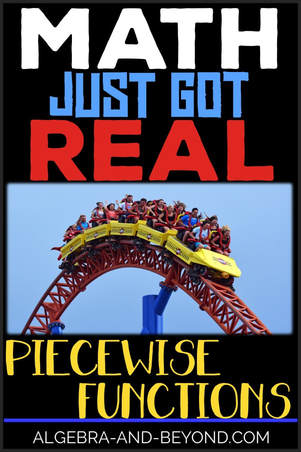
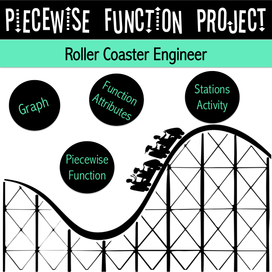
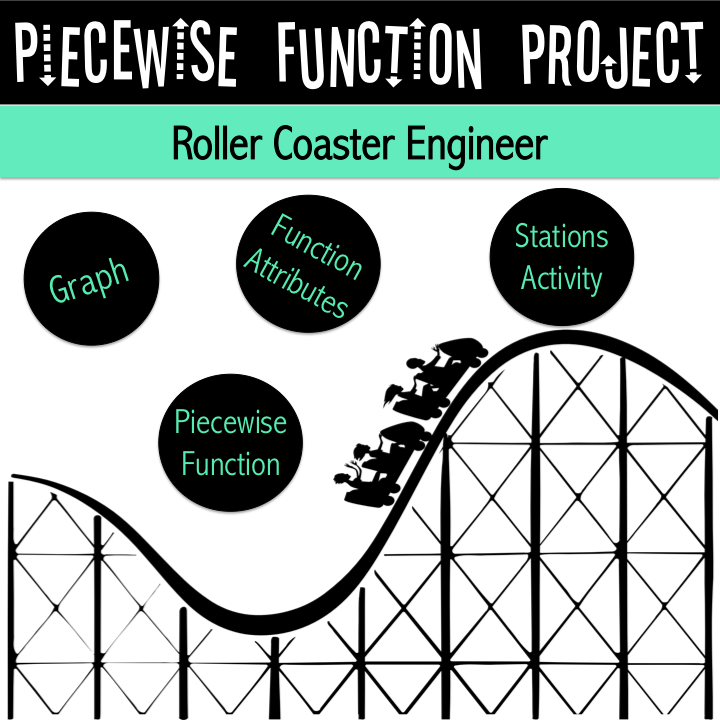
I use to despise teaching piecewise functions. You know when it’s raining out and you forgot your umbrella? What do you do? Well, you run as fast as you can to your car, and as soon as you get in you take a deep breath and think, I made it!...but I’m pretty wet. That’s how I use to teach piecewise functions. I wasn’t prepared, I did it fast, and the results were not great.
A couple of years ago I decided to seriously take a look at how I could teach piecewise functions best. I did some research and decided to make sure I covered how to evaluate, graph, and write the functions. In the past, I had just focused on graphing them and assumed that if students could do that, then they could do anything with piecewise functions. Yeah, I know, wishful thinking. Therefore, I created a lesson that clearly covered those three areas. Then I had my kids dive right into piecewise functions with a project. Let’s be honest, after that one lesson they weren't loving piecewise functions yet. This project was just as important as the lesson because it made piecewise functions come alive. 
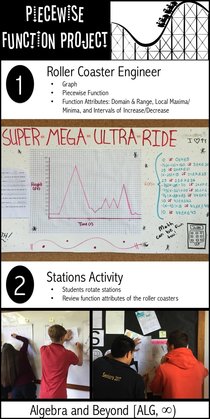
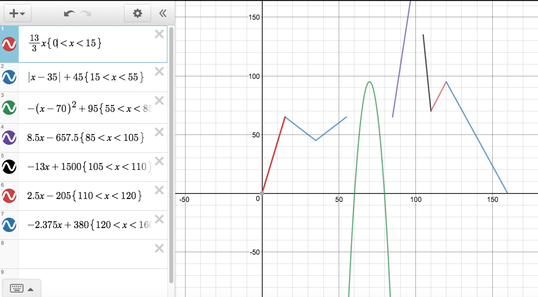
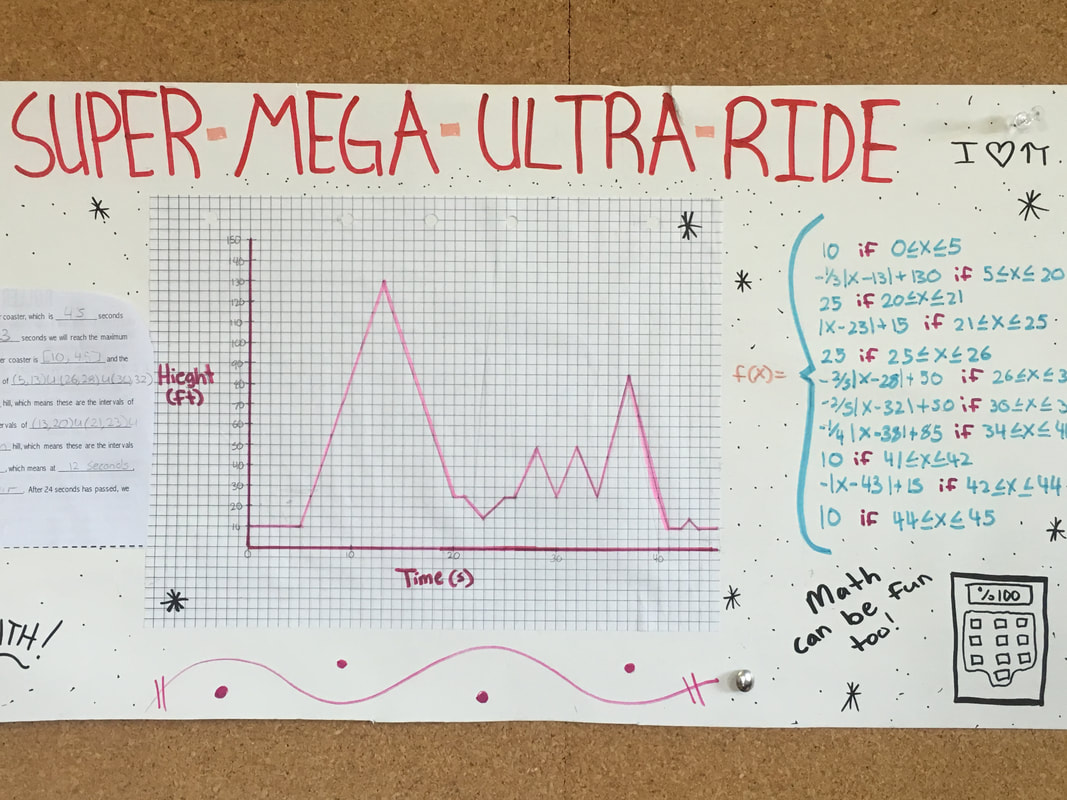
PART A
Students create a graph of a roller coaster in regards to time and height using linear, absolute value, and quadratic functions. I tell them they can pretend that their graph is what the roller coaster looks like as well, because it makes it a little more fun for them. However, we know that physics would not necessarily allow this to be true. (Downhill will not be as fast as uphill as you would see in an absolute value or quadratic function). PART B Students write a function that represents their graph. Some of my students use Desmos to check and see if their function and graph match. This really helps make sure all equations in the piecewise function are correct, and if they don’t, they can adjust their graph accordingly. Another way is to have them check on their graphing calculator. Of course, there will always be some students who don’t do either. I use Desmos when grading the project and this is sometimes what I see... 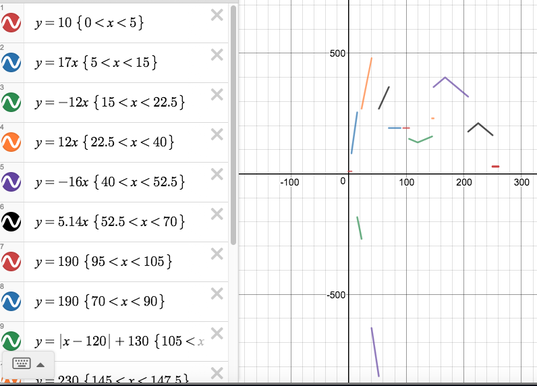
YIKES! Teacher => face plant into desk.
Hmmmm....something is not quite right.
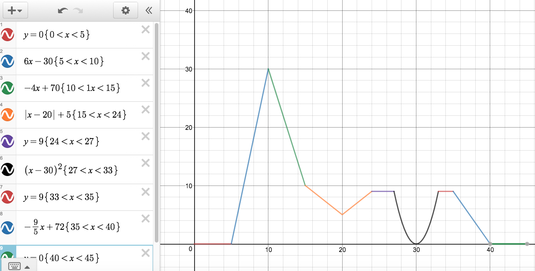
YAY! You got it!
PART C
Let’s go for a ride…. 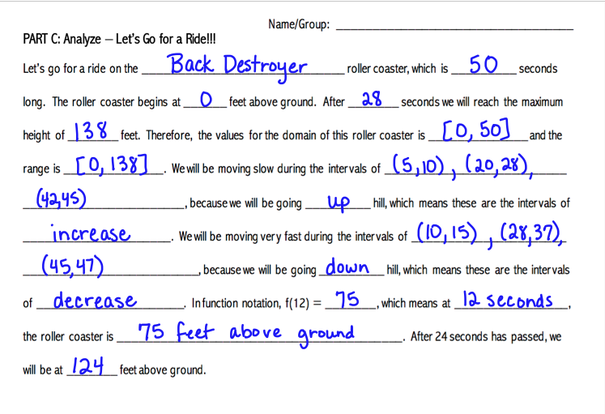
This is a fun way for them to analyze the characteristics of their function.
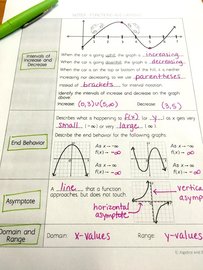
PART D The students create an answer key for their function that identifies the function attributes, which will be used in the stations activity. 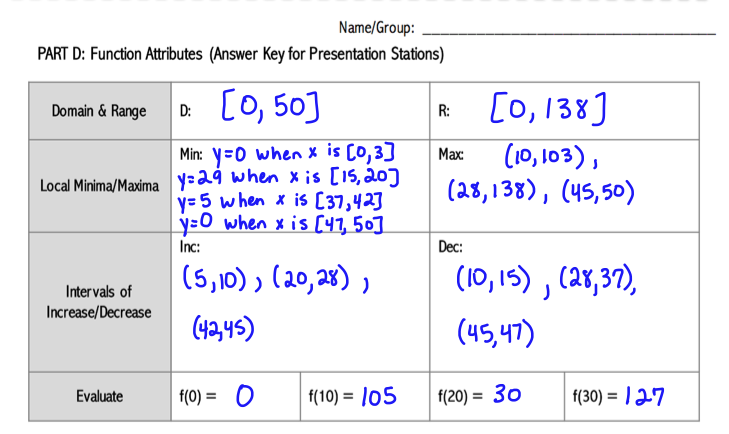
STATIONS ACTIVITY
I do not have students present their roller coaster to the class because it’s not only a bore, but also very time-consuming. Instead, students walk around to a few roller coasters and identify the domain, range, intervals of increase/decrease, minima, maxima, and evaluate for x-values. They get a chance to see other roller coasters and get some review. 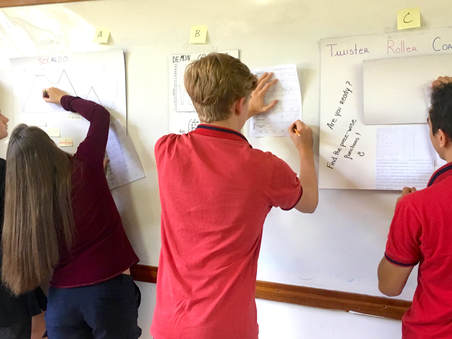
EXTENSION - FIELD TRIP
And finally, the best part! You can take your students on a field trip to an amusement park. The students video record a roller coaster and sketch the graph relating time and height. They love this aspect of the project….a day away from school! Here is one of the videos from our field trip:
I know what you are thinking…I turned 1-2 days of instruction into 5 days. Right, you may not have that kind of time. No worries! You can use the parts of the project that work best for you. Use the video above instead of going on a field trip. Each year I find a way to get as much in as possible because the results are amazing! The new precalculus teacher this year came to me the other day and said, “Wow, the students from Algebra 2 last year really know piecewise functions.” And I said, “Yes, yes they do,” with a big grin on my face. Some things are just worth it.
Want to try this project with your students for FREE?
Subscribe to the Algebra and Beyond mailing list, which gives you instant access to the free resource library where you can find this project and many more resources!
You can find all the resources mentioned in this post here:
|

Hello there,
|


 RSS Feed