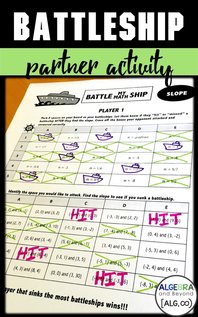
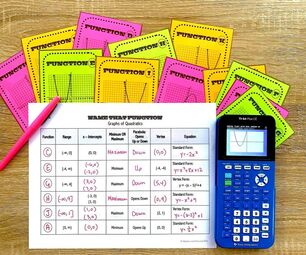
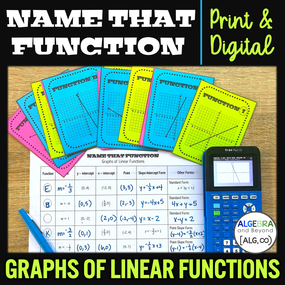
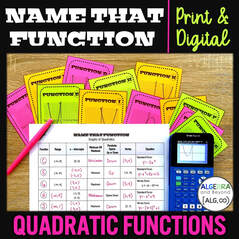
 My math catchphrase is “connecting knowledge with understanding”, which you can read more about HERE. Every time I create an activity, this phrase is what I think about. It helps me stay focused on the true goal and outcome of what I want for each activity. There is one activity in particular that really embodies this statement. It’s an activity that I’ve used over and over with my students for different types of functions. At first, students tend to have productive struggle with this activity. BUT once they get the hang of it, they realize how making these connections helps them fully understand functions and their graphs. I call this activity Name That Function. What is Name That Function? Name That Function is an activity where students analyze graphs of functions and make connections to their characteristics and the function that represents each graph. Students are given a fill-in-the blank table where some information is already given. Then they match the graphs to the characteristics and fill in the missing information. There are different activities based on the type of function being studied. Each activity includes a print and digital version. Here are the different types of Name That Function activities and what attributes are reviewed: Linear Functions slope, y-intercept, x-intercept, points on the line, slope-intercept form, point-slope form, standard form, and parallel and perpendicular lines (optional).
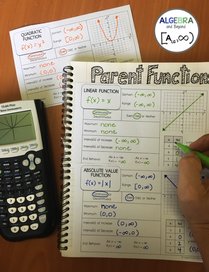
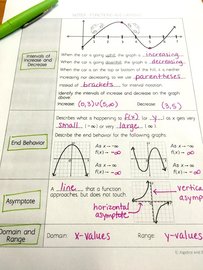
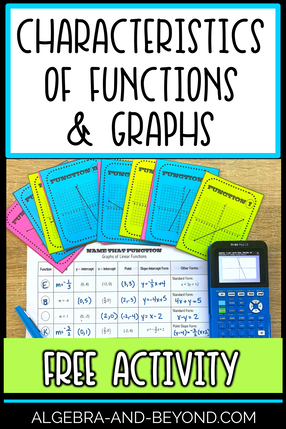
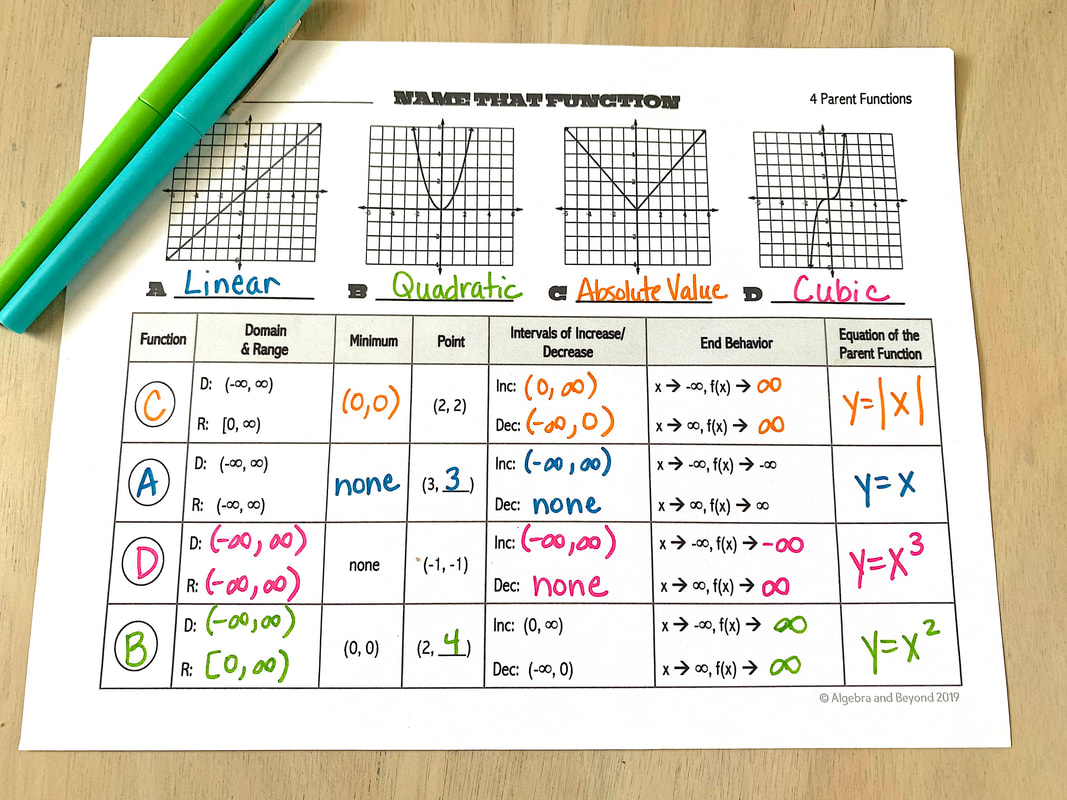
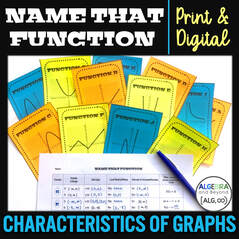
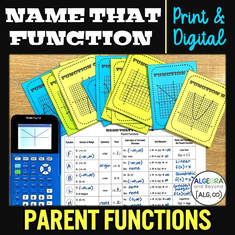
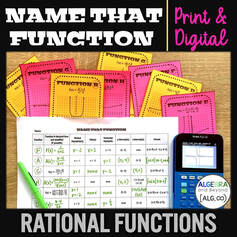
Characteristics of Functions domain, range, intercepts, local min, local max, intervals of increase and decrease, end behavior, parent functions, continuity, and evaluating a function from a graph Rational Functions factor and simplify, vertical asymptotes, holes, horizontal asymptotes, x-intercepts, y-intercepts, and domain Parent Functions domain, range, symmetry, intervals of increase and decrease, end behavior, and the parent function equation 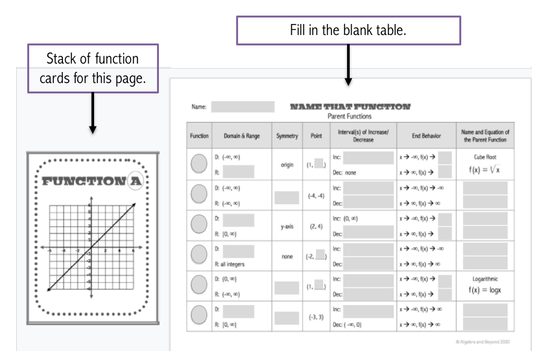 Digital Version Why is this activity helpful? I cannot tell you how many times students treat equations and graphs as separate entities that have no connection. When, in fact, everything about them is 100% connected! I think this happens because we, as teachers, scaffold the content, and in doing so separate each aspect of a function into separate lessons. Which makes them appear disconnected. Great news! This activity brings an entire function unit together, so students can understand functions based on the equation, attributes, and graph as a whole. Do students enjoy this activity? Yes, my students enjoy making these connections and feel more prepared for assessments because of it! But you don’t have to take my word for it. Here are some reviews from other math teachers that have used these activities in their classroom as well: Great activity! Worked out perfectly in my stations and my students were very engaged! Thank you for sharing your creativity with me! – TexasMath4Success Excellent resource! Really helped my students make the connections I wanted them to make. Thank you! – Passion 4 Mathin This was a great activity after our introductory lesson. Students were able to compare and contrast different types of quadratics and it reinforced the concepts of min/max and vertex form. – Anna K. I used this as a group test in my class. Students loved the activity and we’re challenged to really understand all aspects of quadratic functions. – The Square Root of Teaching Great activity - my kids were able to apply their understanding and had great math conversations while they were working together. – Heather K. Such rich discussions took place with this activity. It worked great as a chapter review. – Michelle E. Was very helpful for my students of different levels, engaging – Shan H B. Perfect activity to test students knowledge and application of properties of quadratics and how they affect both graph and equations. – Grove Math This resource had just the rigor I was looking for! Thank you! I had my students use it in groups. I used part A for my on-level class and part B for my honors class. Great resource! – Theresa Simmons This activity engages students to understanding characteristics of function families. Great discourse and enrichment activity. – Tony R. Used for an in-class activity. Engaging and fun for students. Activity was thorough with great examples included. – Kristina R. Students had to think to get the whole picture. Thanks! – Lynn S. Can’t wait to get your hands on a Name That Function?! No problem, I have TWO waiting for you for FREE! If you are NEW to Algebra and Beyond, CLICK on either image below to sign up and receive the activities. If you are already part of the Algebra and Beyond Community, click HERE and use the member passcode to access the activities.
Are you already convinced that your students will LOVE this activity?! Choose the activities that best fit your curriculum:
6 Comments
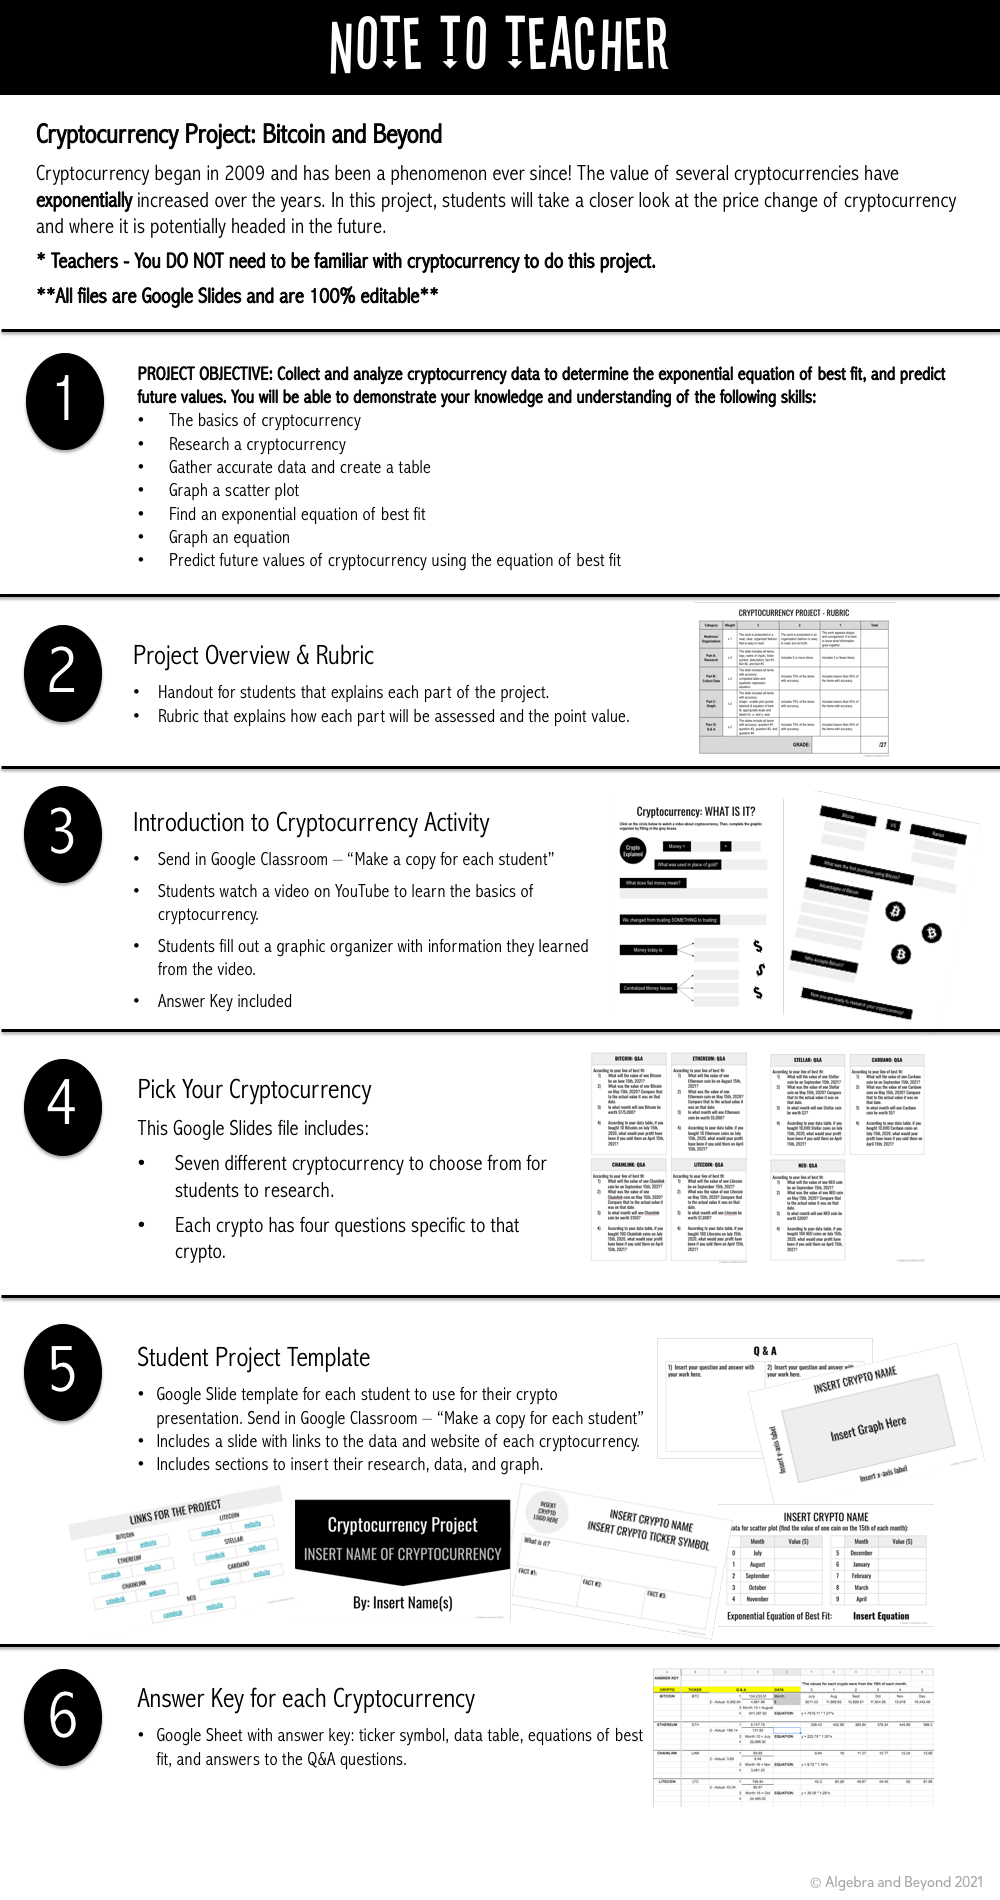
 Cryptocurrency began in 2009 and has been a phenomenon ever since! The value of several cryptocurrencies has exponentially increased over the years. This is REAL WORLD math at it’s finest! Okay, admittedly, I knew next to nothing about cryptocurrency, besides that it existed, until this year. More and more of my friends and family have been interested in and investing in crypto. It got me very curious about what it is and why are people buying it. As I dove more into it, I realized that the trend of several cryptocurrencies would be perfect for an exponential regression project. And quite frankly, digital currency is VERY exciting, as this isn’t something we’ve experienced ever before in history. It’s a brand new type of currency! So, here are the details… In this project, students will take a closer look at the price change of cryptocurrency and where it is potentially headed in the future via historical data and finding an exponential equation of best fit. What is cryptocurrency? I’m sure you’re thinking that if you don’t know anything (or much) about cryptocurrencies that you can’t use this project with your students. WRONG. I’ve included a “Cryptocurrency: What is it?” introduction activity. This will help give the students (and you) enough basics about cryptocurrency in order to complete the project.  CRYPTOCURRENCY: BITCOIN AND BEYONDOBJECTIVE Students are to find the curve of best fit for a exponential function in the real world by performing the following:
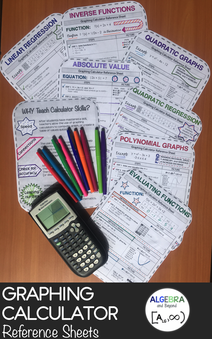
RESEARCH & COLLECTING DATA Students are given a specific cryptocurrency to research. The research includes finding the ticker symbol, learning what their currency is, three facts about their cryptocurrency, and collecting pricing data for their currency over a specific time period. GRAPHING & RESULTS Students use the TI-84 graphing calculator to find the exponential regression equation. Then they use Desmos to create a scatter plot and graph the exponential regression equation. Students answer questions to help them understand and analyze their results, including future price predictions for their cryptocurrency. VISUALS A Google Slides template is provided, so students can type in their information in the specific location. They then can easily turn their project into you via Google Classroom or email. 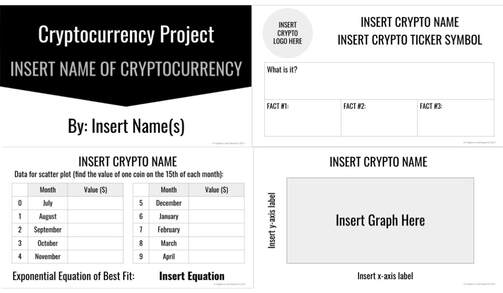 GRADING An answer key that gives the data, equation of best fit, and the answers to the questions is included for each cryptocurrency. A rubric is provided, so you can easily evaluate each aspect of the project. It is great for students to use, so they know exactly what is expected of them.
Most of my students knew nothing about cryptocurrency when they began this project. But, they were intrigued because they’ve heard about cryptocurrency AND knew some businesses that were beginning to accept it for payment. Why not learn more for themselves?! This is a cutting edge project that you don’t want your students to miss out on! Click on the cover below to go directly to this project:  More mathtastic real world projects for your students:
|

Hello there,
|


 RSS Feed