I use to despise teaching piecewise functions. You know when it’s raining out and you forgot your umbrella? What do you do? Well, you run as fast as you can to your car, and as soon as you get in you take a deep breath and think, I made it!...but I’m pretty wet. That’s how I use to teach piecewise functions. I wasn’t prepared, I did it fast, and the results were not great.
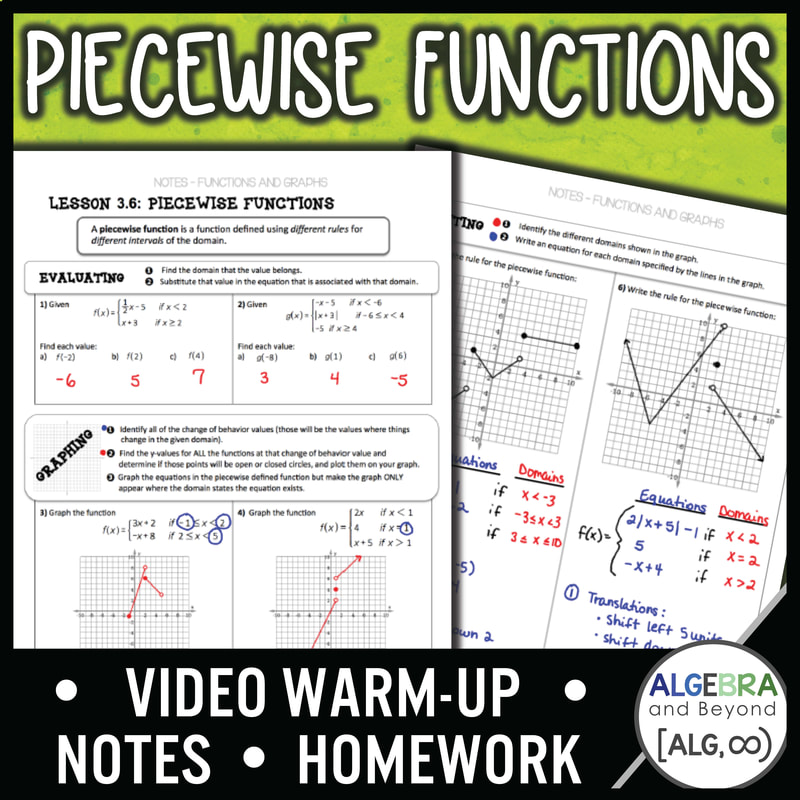
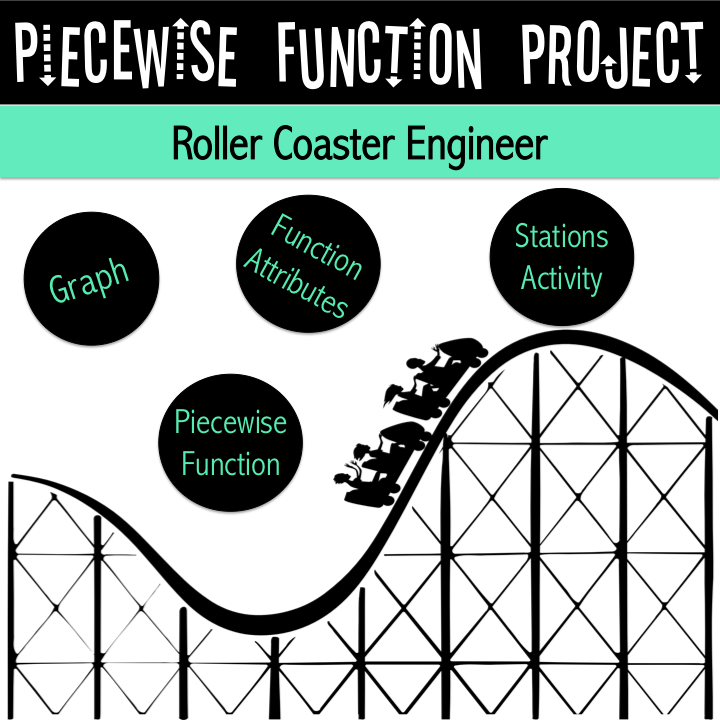
A couple of years ago I decided to seriously take a look at how I could teach piecewise functions best. I did some research and decided to make sure I covered how to evaluate, graph, and write the functions. In the past, I had just focused on graphing them and assumed that if students could do that, then they could do anything with piecewise functions. Yeah, I know, wishful thinking. Therefore, I created a lesson that clearly covered those three areas. Then I had my kids dive right into piecewise functions with a project. Let’s be honest, after that one lesson they weren't loving piecewise functions yet. This project was just as important as the lesson because it made piecewise functions come alive.
PART A
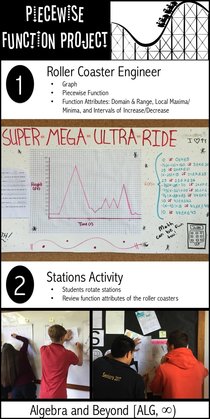
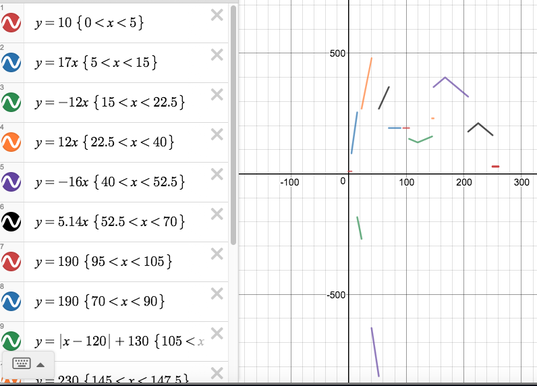
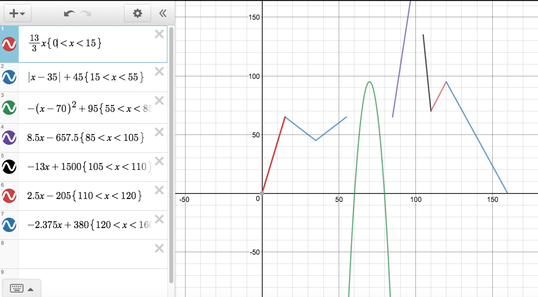
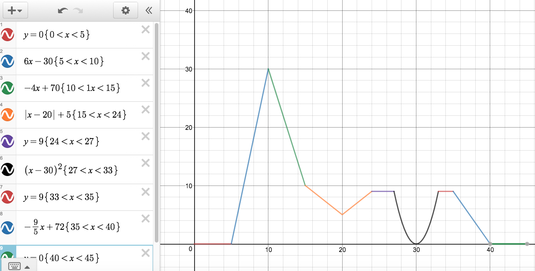
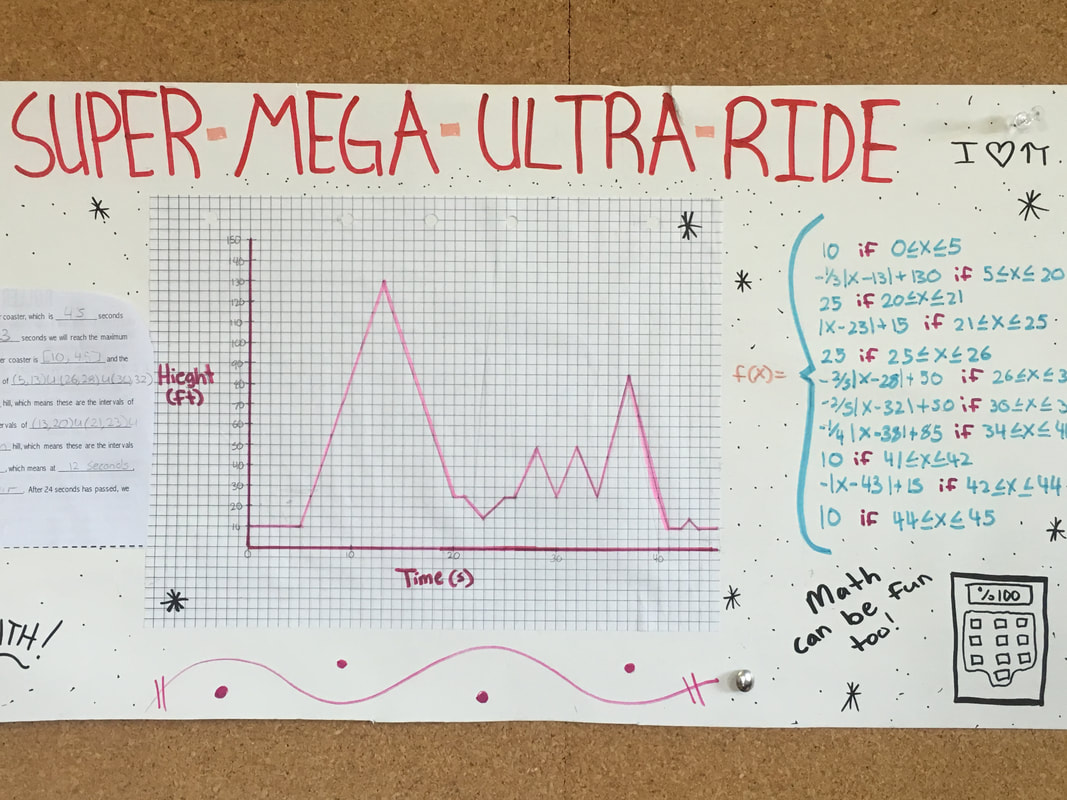
Students create a graph of a roller coaster in regards to time and height using linear, absolute value, and quadratic functions. I tell them they can pretend that their graph is what the roller coaster looks like as well, because it makes it a little more fun for them. However, we know that physics would not necessarily allow this to be true. (Downhill will not be as fast as uphill as you would see in an absolute value or quadratic function). PART B Students write a function that represents their graph. Some of my students use Desmos to check and see if their function and graph match. This really helps make sure all equations in the piecewise function are correct, and if they don’t, they can adjust their graph accordingly. Another way is to have them check on their graphing calculator. Of course, there will always be some students who don’t do either. I use Desmos when grading the project and this is sometimes what I see...
YIKES! Teacher => face plant into desk.
Hmmmm....something is not quite right.
YAY! You got it!
PART C
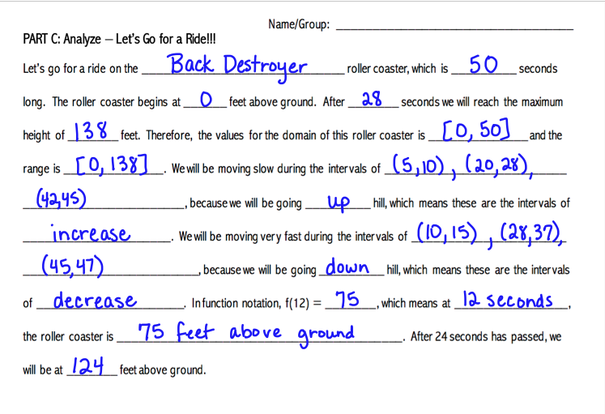
Let’s go for a ride….
This is a fun way for them to analyze the characteristics of their function.
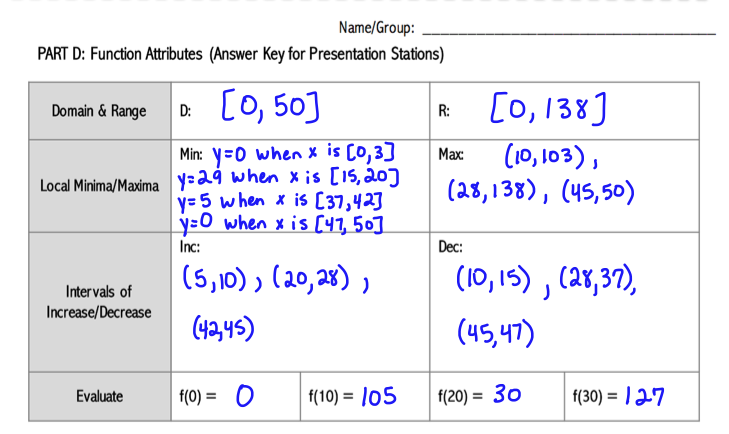
PART D The students create an answer key for their function that identifies the function attributes, which will be used in the stations activity.
STATIONS ACTIVITY
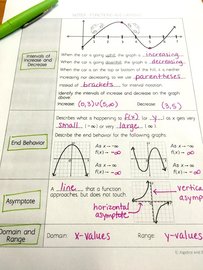
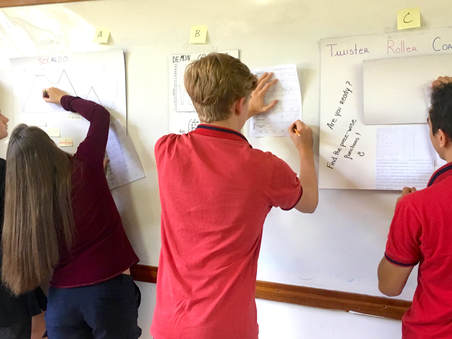
I do not have students present their roller coaster to the class because it’s not only a bore, but also very time-consuming. Instead, students walk around to a few roller coasters and identify the domain, range, intervals of increase/decrease, minima, maxima, and evaluate for x-values. They get a chance to see other roller coasters and get some review.
EXTENSION - FIELD TRIP
And finally, the best part! You can take your students on a field trip to an amusement park. The students video record a roller coaster and sketch the graph relating time and height. They love this aspect of the project….a day away from school! Here is one of the videos from our field trip:
I know what you are thinking…I turned 1-2 days of instruction into 5 days. Right, you may not have that kind of time. No worries! You can use the parts of the project that work best for you. Use the video above instead of going on a field trip. Each year I find a way to get as much in as possible because the results are amazing! The new precalculus teacher this year came to me the other day and said, “Wow, the students from Algebra 2 last year really know piecewise functions.” And I said, “Yes, yes they do,” with a big grin on my face. Some things are just worth it.
Want to try this project with your students for FREE?
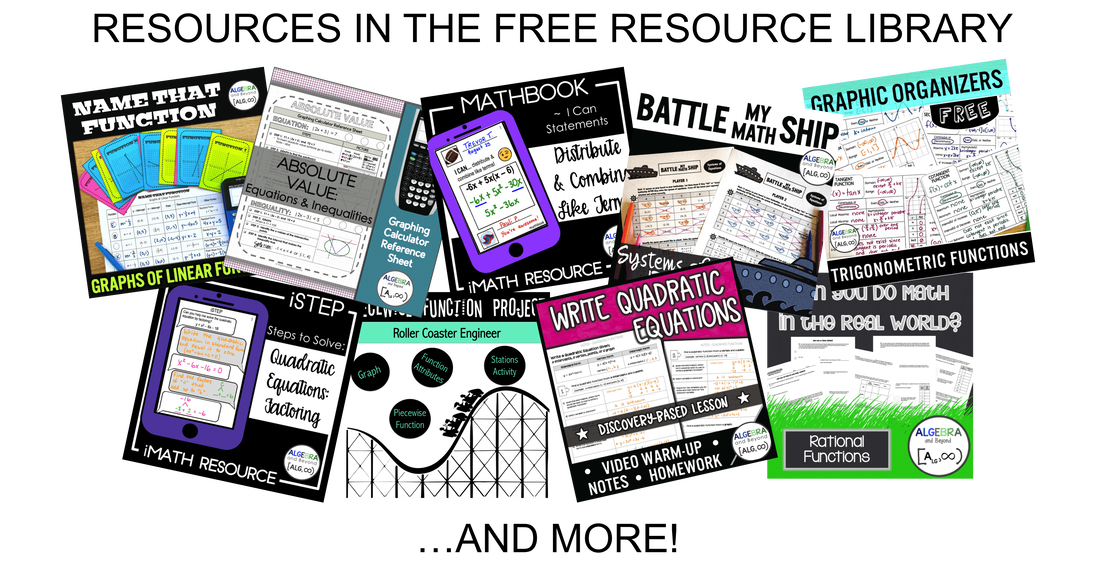
Subscribe to the Algebra and Beyond mailing list, which gives you instant access to the free resource library where you can find this project and many more resources!
You can find all the resources mentioned in this post here:
5 Comments
|
Hello there,
|



 RSS Feed

