If you’ve visited my website before, you know I’m all about real-world math projects that come straight from my classroom. Today, I’m pulling back the curtain to reveal my process of creating these projects from the beginning to the end. That’s right, I’ll explain my FIVE “must haves” for designing math projects. This blog post is your access to fresh ideas and handy tools, so you can create your own math projects for your classroom! Let the creativity begin…
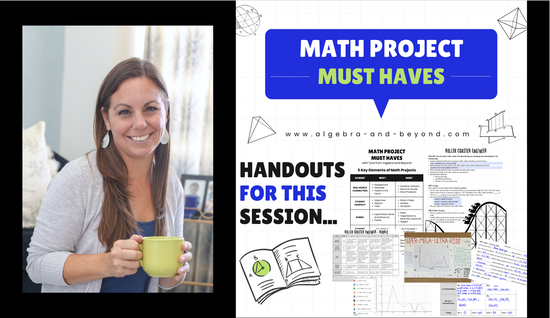
If you want ALL the Math Project Must Have details via video and download the FREE notes and example project, CLICK HERE. 
Real World Connection
Why does this matter? By exploring the common question of “how does math apply to real life?”, we are naturally unlocking student interest. Connecting the math they are learning to everyday situations makes it easier for them to understand and keeps students engaged because it’s relatable. Plus, real-world projects are training for the future. When students create projects that mirror actual situations they might encounter later in life, they are getting a sneak peek into the challenges and problem-solving they’ll face. Student Handout Why do students need this? Knowing the objectives and directions for a math project is like having a roadmap for a journey. It gives students a clear sense of what needs to be done and the knowledge and skills they will demonstrate along the way. Objectives – helps students grasp the purpose of the project Directions – act as a guide, explaining the steps to take to complete the project Alignment – ensures that the project accurately matches your standards A handout not only helps students stay organized, but also keeps them focused on the key aspects and assists them to work more efficiently. Rubric What’s the purpose of this? A rubric breaks the project down into bight-sized pieces, making it easier to understand the expectations and levels of proficiency. It also allows you to weight different aspects of the project by importance. Example You may be wondering if having an example project is really necessary? The answer is a resounding YES! Let me explain why. I was filling in for another teacher and the students were starting a new project. Quite a few of them wished they had an example to look at, so they knew what a finished project would look like. That got me thinking–this visual aid is gold for students, perhaps even more important than the rubric. I’ve always made it a point to include an example project for my students because, let’s face it, student directions and a rubric don’t always paint a full picture. A visual example though? Now that’s the game-changer students need to create an amazing project. Answer Key Let’s face it, answer keys are the holy grail for math teachers for efficiency and making grading student work a breeze. It’s also crucial to be able to check students’ answers as they work through a project. Designing projects that facilitate unique answers for every student is my goal, however, this makes it tricky to create an answer key. I have a few tips on how to easily create answer keys that can be used to quickly type in each student’s unique answer to see if they are correct. 
I’ve revealed my FIVE key elements for creating a quality math project and why they’re game changers. Are you excited to learn HOW you can add all of these elements into your own projects? Mathtastic! I’ve got a FREE video session and downloadable handouts waiting for you, so you can take your projects to the next level! Let’s make learning math a whole lot more exciting!
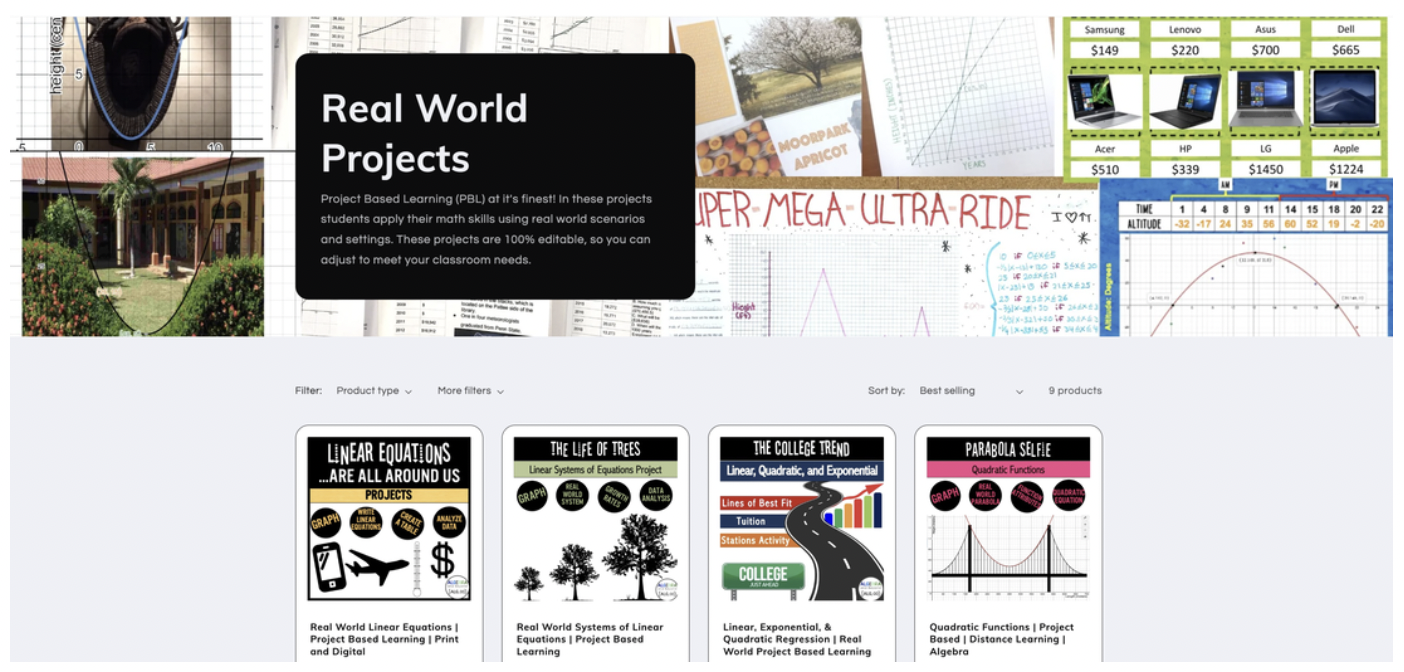
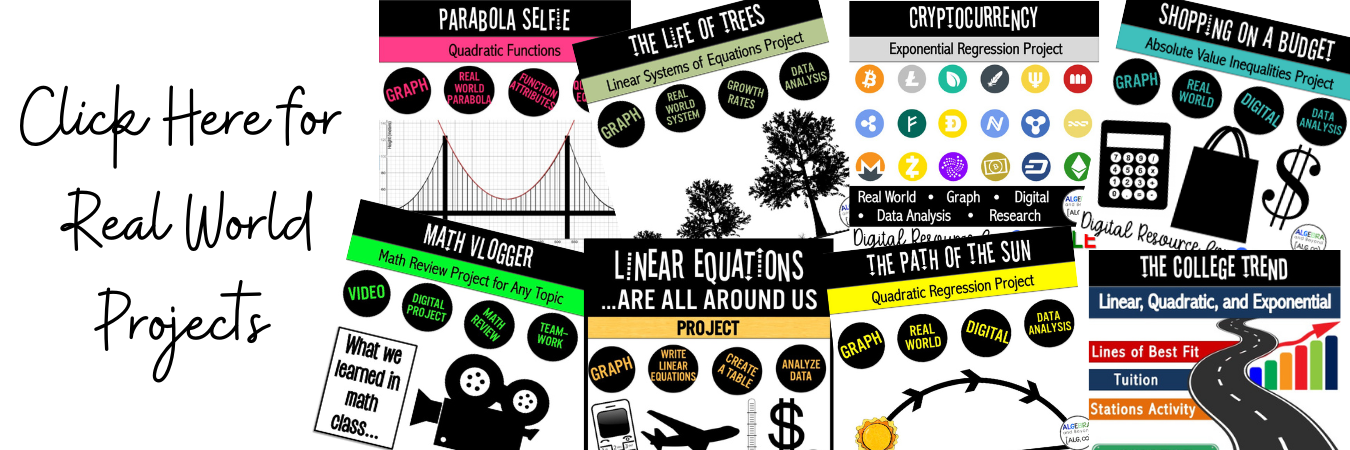
Don’t have time to make your own math projects? I totally understand, that's why I've got you covered! Check out my favorite real world math projects by clicking on this image:
4 Comments
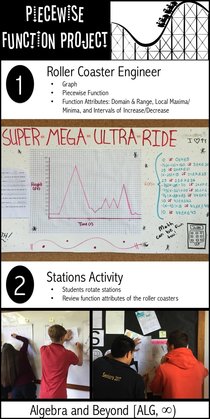
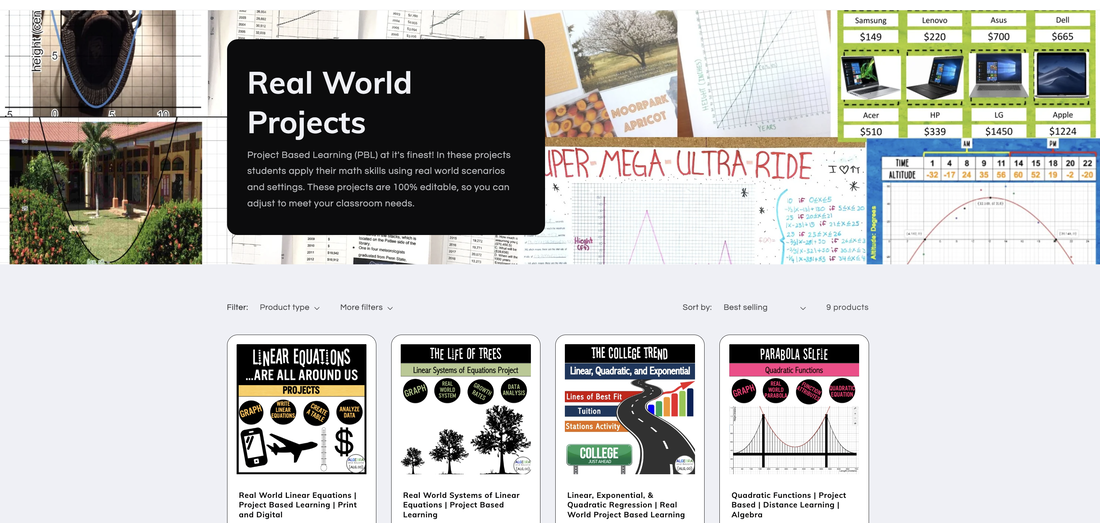
 Let’s talk math projects…. As a teacher, I love to implement projects into as many units of study as possible. Projects can push students to use a higher level of thinking, because often, projects include more creativity, application, evaluation and analyzation than the average assignment or activity. This is a great way for us, as teachers, to see that students’ have the capability to expand upon their skill set. Students also enjoy doing something outside the normal lesson. Projects can give students’ choice, which can boost their engagement and motivation, allow them to capitalize on their interests and strengths, and enable them to meet their individual learning needs. Projects are a teacher and student win-win! Therefore, my math friends and I want to share with you some of our FAVORITE math projects that you can use in your classroom! Let’s start with the projects I use in my classroom… Students ALWAYS ask how will we use this math in the real-world?! Therefore, I create projects that have students use their math skills in real-world scenarios. They're also perfect for a summative assessment at the end of a unit OR integrated within a unit. Either way, you are answering that forever dreaded question of how math is used in real life! Read about some of the projects I’ve created for my students:
MORE PROJECTS |


| Volume and Surface Area Real World Project – Amanda Nix, Free to Discover Engage students in geometric measurement through design, persuasive writing, and hands-on learning! | 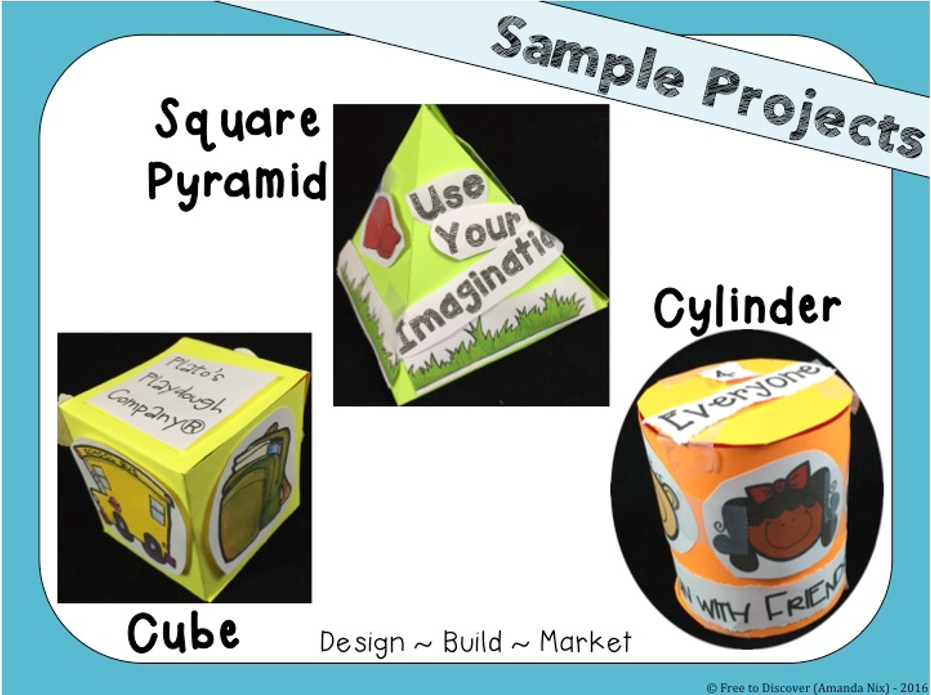 |
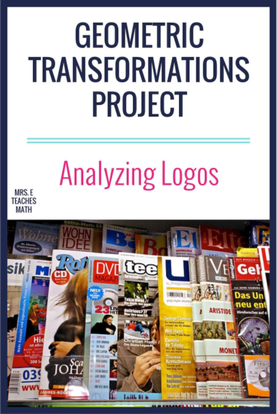
Geometric Transformations Logo Project
– Mrs E Teaches Math
This project is a great way for students to demonstrate their learning about transformations in Geometry! Students will look for real-world examples of logos and relate them to translations, rotations, reflections, and dilations.
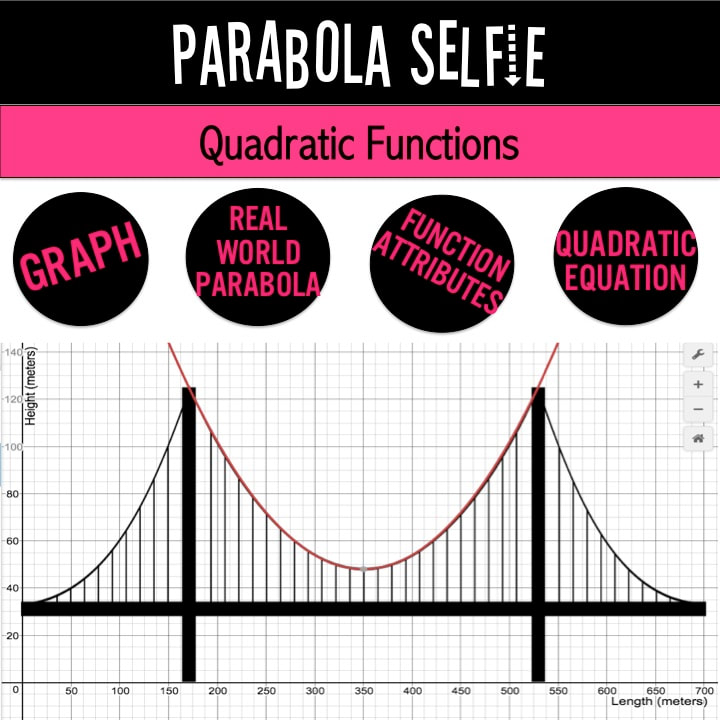
| Selfieometry – Kacie Travis, The Efficient Classroom Looking for a way to assess or reinforce what your Geometry students have learned? This project combines Geometry with the craze of “The Selfie!” It assesses the student's ability to apply Geometry concepts to the real world with a fun, highly relevant spin! | 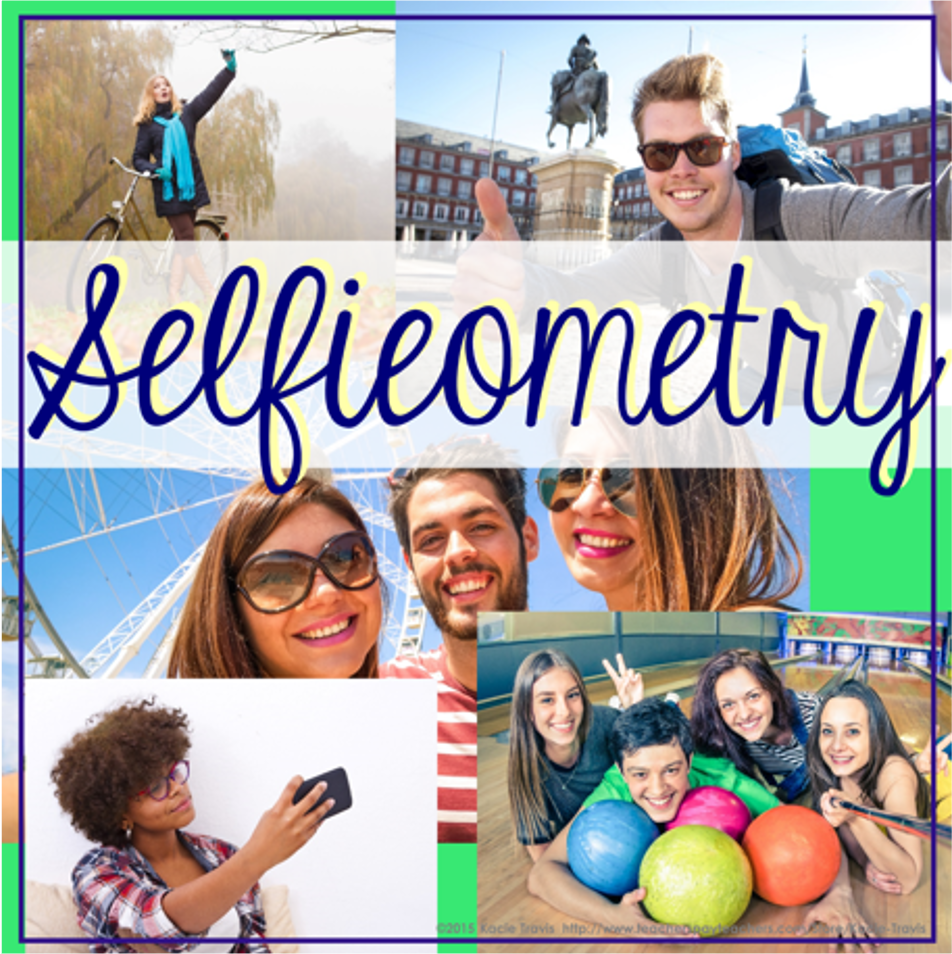 |
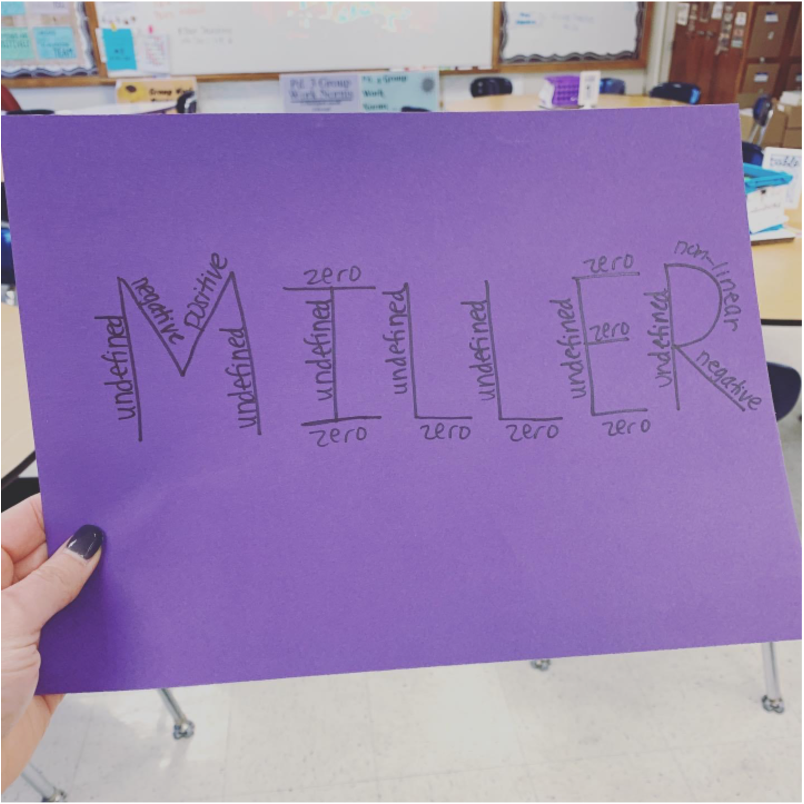 | Slope Mini Project – Jamie Miller Math Looking for a fun way to practice slope? Students pick a word and illustrate the different kinds of slope! |
| Graphing Grass Linear Equations Project – Scaffolded Math and Science The project is so simple - students plant seeds, grow grass, measure, plot growth, find lines of fit - but the learning opportunities stretch the project so much farther. | 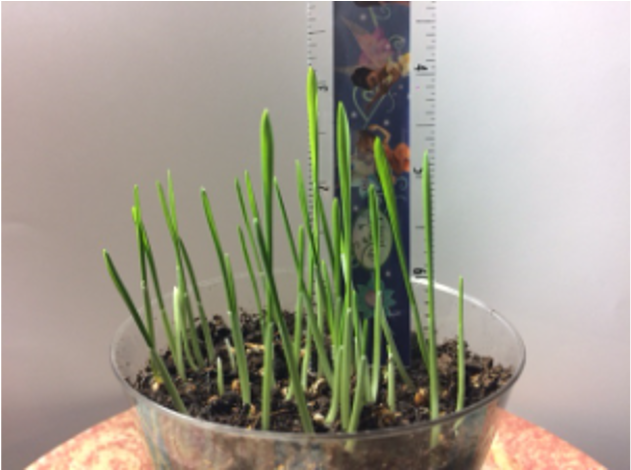 |
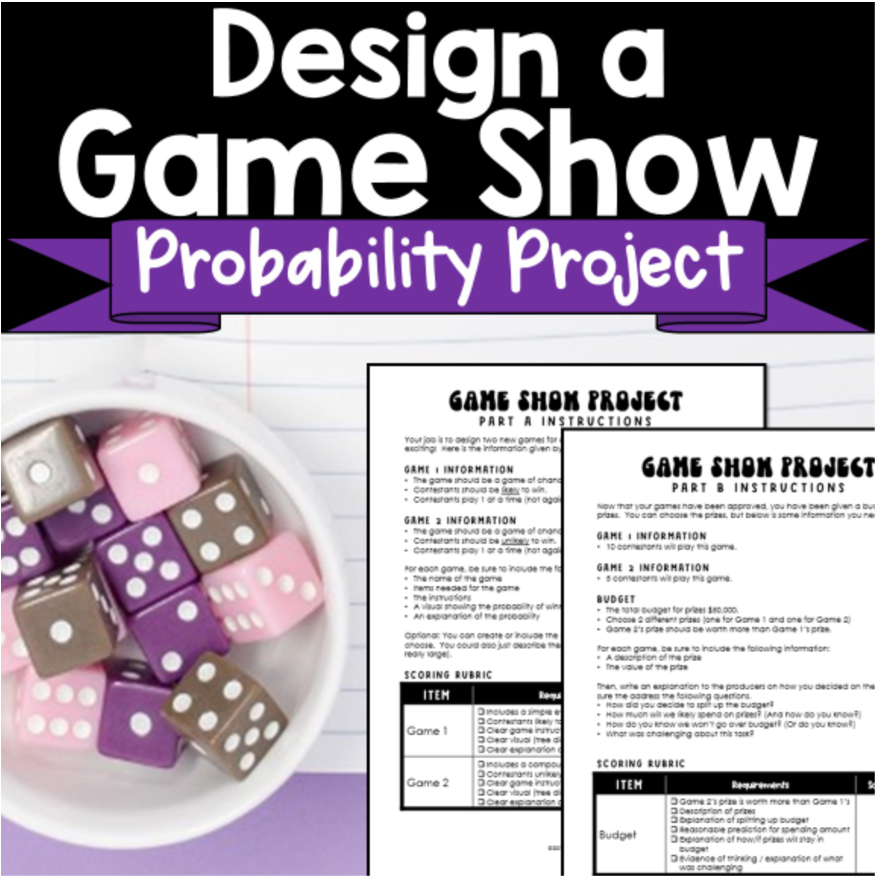 | Design a Game Show Using Probability - Rise Over Run Students use what they know about probability to create their own game show. They can get creative and even test out their games! Instructions are included to guide students in designing a game based on a simple event, designing a game based on a compound event, explaining the probabilities of winning, and choosing prizes based on a budget and probabilities of winning. |
| Math is Everywhere Project – Middle School Math Man Get students thinking about how they see math in the real world with this Math is Everywhere Project. Students combine art and math to create a tile that shows how they see math outside of the classroom. These make an amazing bulletin board display! | 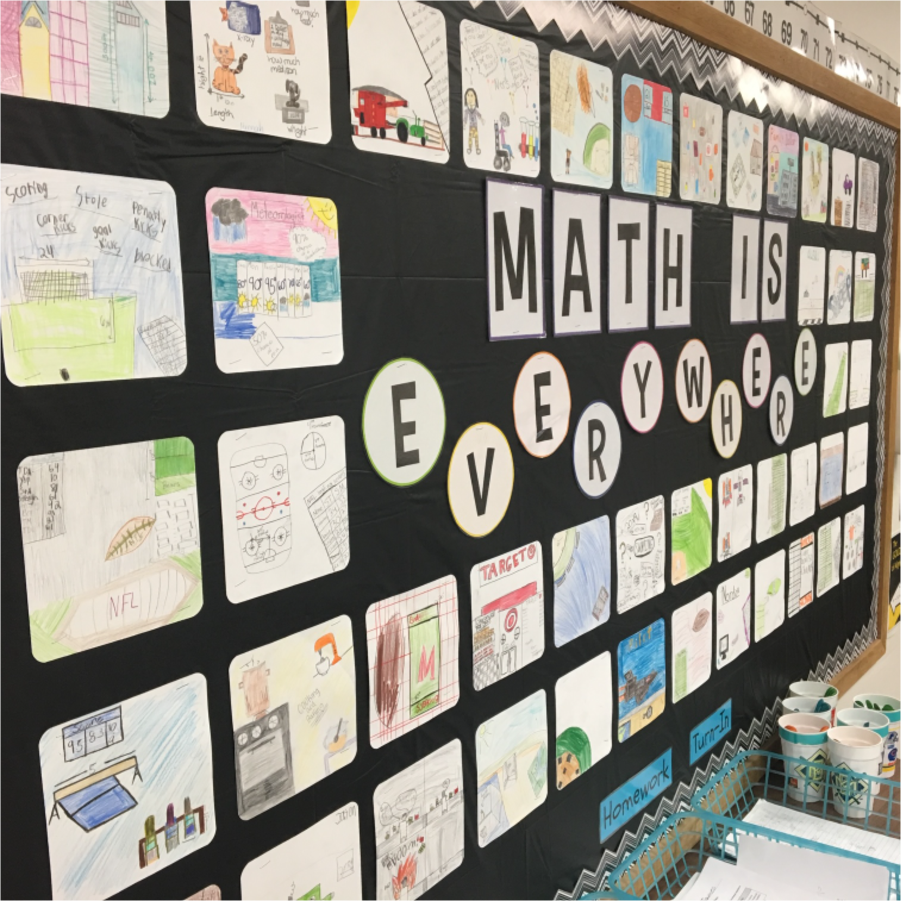 |
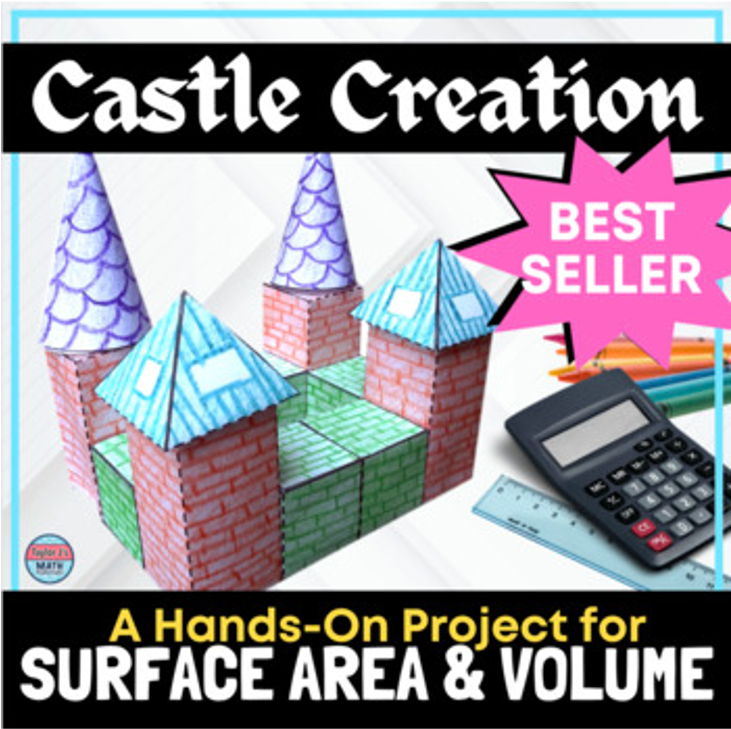 | Castle Creation: A Surface Area and Volume Project – Taylor J's Math Materials Castle Creation is a great surface area and volume project that challenges students to CREATE, MEASURE, and CALCULATE the surface area and volume of several 3-D figures while building a one-of-a-kind castle! |
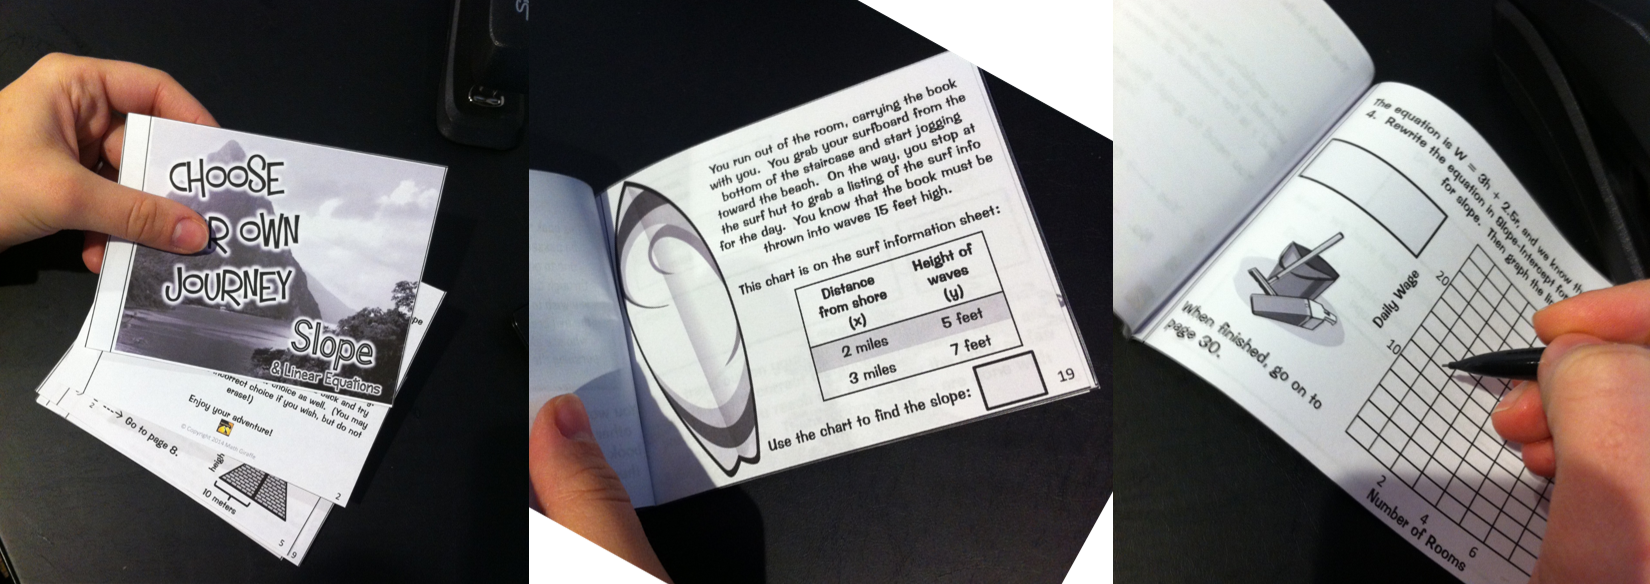
Linear Equations are All Around Us!
This was the FIRST project I ever made for my students.
It made me fall in love with integrating projects into my classroom.
I created it in a way that gives students' options of topics and various levels of difficulty.
And most importantly, my students had FUN doing math!!!
There are soooo many real-world scenarios that involve linear equations, but I tried to use a variety of ones that were most relevant for teenagers. Each of the following topics are included in this project:
- Cell Phone Plans
- Hourly Wages
- Frequent Flyer Miles
- Temperature Conversion
- Taxi Fares
- Car Depreciation

Analyze a linear equation in a real-world setting. You will be able to demonstrate your knowledge and understanding of the following skills:
- Write a linear equation that represents a real-world scenario.
- Create a table to represent data for the linear equation.
- Graph the linear equation.
- Create a visual demonstrating this real-world scenario.
- Answer questions about the real-world scenario by analyzing the equation, table, and graph.
RESEARCH & COLLECTING DATA
Students determine the rate and write an equation for the real-world scenario. Some projects require a little research, but a link is included to help them find the data. Then, they use the linear equation to fill in a table.
GRAPHING & RESULTS
Students graph the linear equation and plot the ordered pairs. I suggest they use graph paper or Desmos. Students label important information on the graph: x-axis, y-axis, ordered pairs, and use an appropriate scale. Students then analyze their equation, table, and graph by answering questions.
VISUALS
Students create a visual demonstration of the real-world scenario by drawing or using an image from the internet.
GRADING
A Google Sheets answer key for each scenario is included, so you can insert any rate of used in each project and it automatically calculates the information needed for grading. A rubric is also provided, so you can easily evaluate each aspect of the project. It is great for students to use, so they know exactly what is expected of them for each part of the project.
What’s included in the project?
- 6 student projects (print & digital) – various levels of difficulty and perfect for differentiation
- Note to Teacher – an overview of the project
- Answer Keys
- Rubric
- Example Project
EVERYTHING in this project is 100% editable!
Click on the video below to see an overview of the elements in the project:
Click on the image below to view this project:
Well, guess what?! I have some MATHTASTIC resources to share with you that you can either use in-person OR virtual because they are printable and digital. That’s right, with ONE resource you have access to both versions, which means you can switch from in-person teaching to virtual (and vice versa) and continue with your original lesson plans.
Start using these resources today to save yourself the frustration of having to change your lesson last minute!
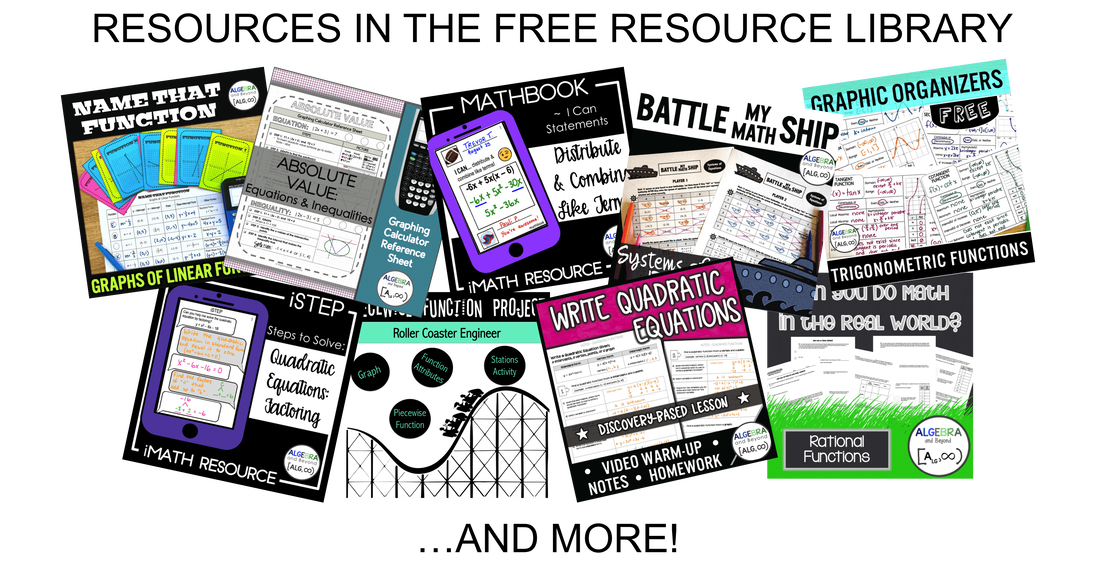
ALGEBRA AND BEYOND PRINT & DIGITAL RESOURCES:
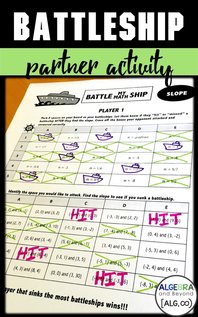
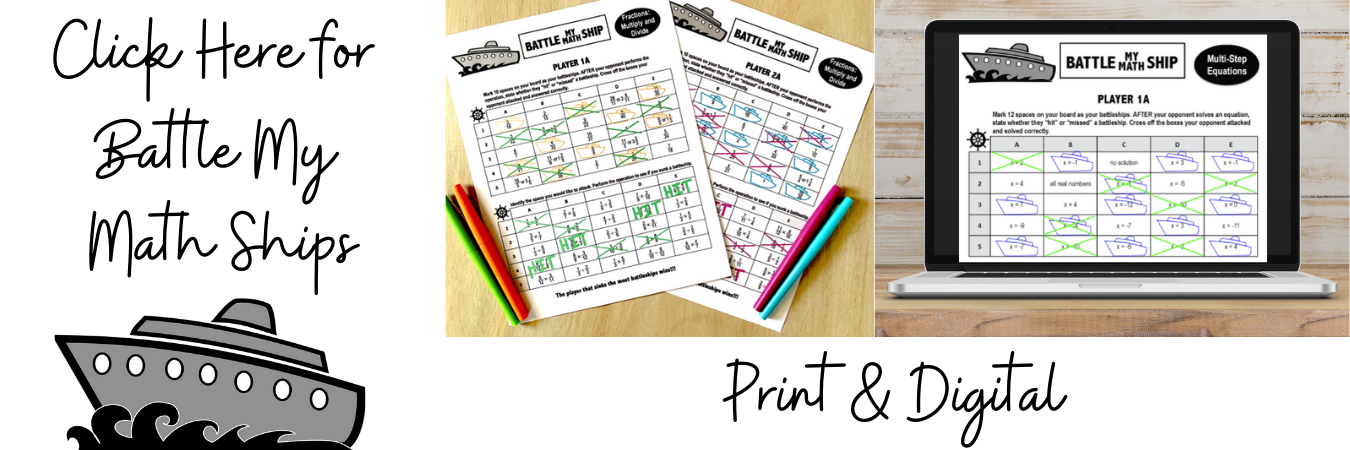
BATTLE MY MATH SHIP – Students love this spin on the classic game of Battleship! Students try to sink their opponents' ships by solving math problems. Perfect partner activity to review any math topic. Set them up in a breakout room and away they go! Over 70 battleships to choose from!
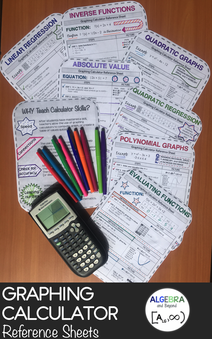
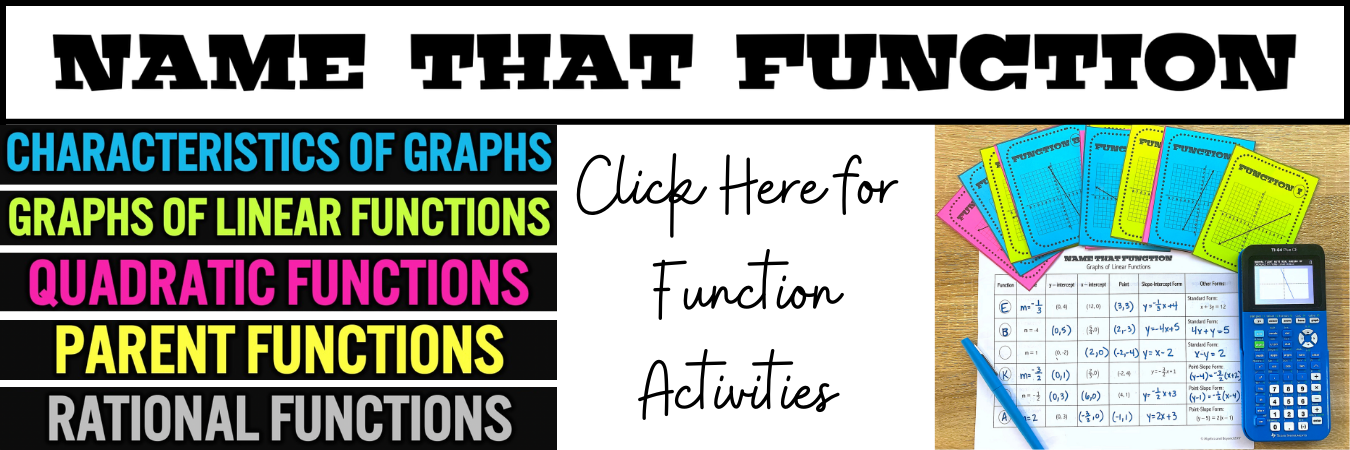
NAME THAT FUNCTION – Working with functions? Great! These activities help students critically think about graphs and their attributes. These were the best for when I had half my class in person and half virtual because students could discuss and learn together no matter their location.
MORE MATHTASTIC PRINT & DIGITAL RESOURCES:
*Click on the name or image to go to the resources.
| GEOMETRY TASK CARDS from Kacie Travis – Task Cards are great for independent or collaborative work! They are also a fun station activity. These can also be assigned digitally for another helpful option! Read more about these task cards HERE. | 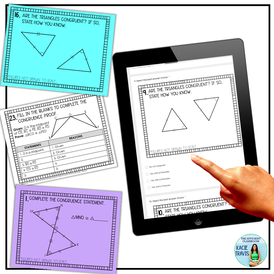 |
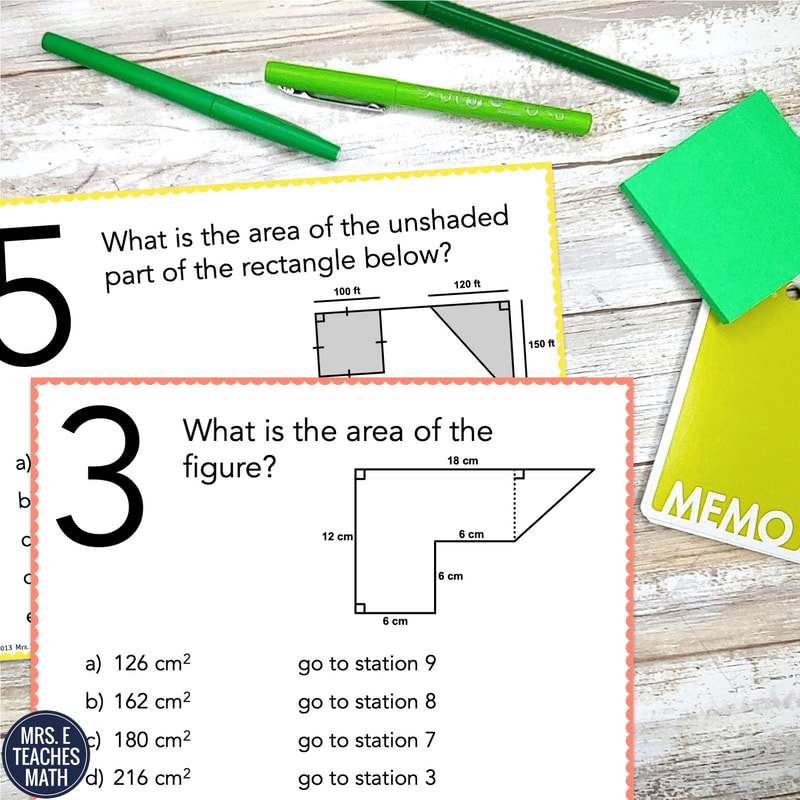 | STATIONS MAZE from Mrs. E Teaches Math – Stations mazes are great because they get students up and moving around the room. They also encourage students to check their work carefully since an incorrect answer will eventually send them back to a problem they have already solved. A digital version is included for absent students. |
| BOOM CARDS from Kate's Math Lessons – Your students will LOVE getting instant feedback with these digital task cards! In a nutshell, Boom Cards are interactive, self-checking activities. Students are shown one question at a time and get immediate feedback on their answers. Boom Cards can also be printed if you prefer paper task cards for stations, games, or scavenger hunts. Read more about these activities HERE. | 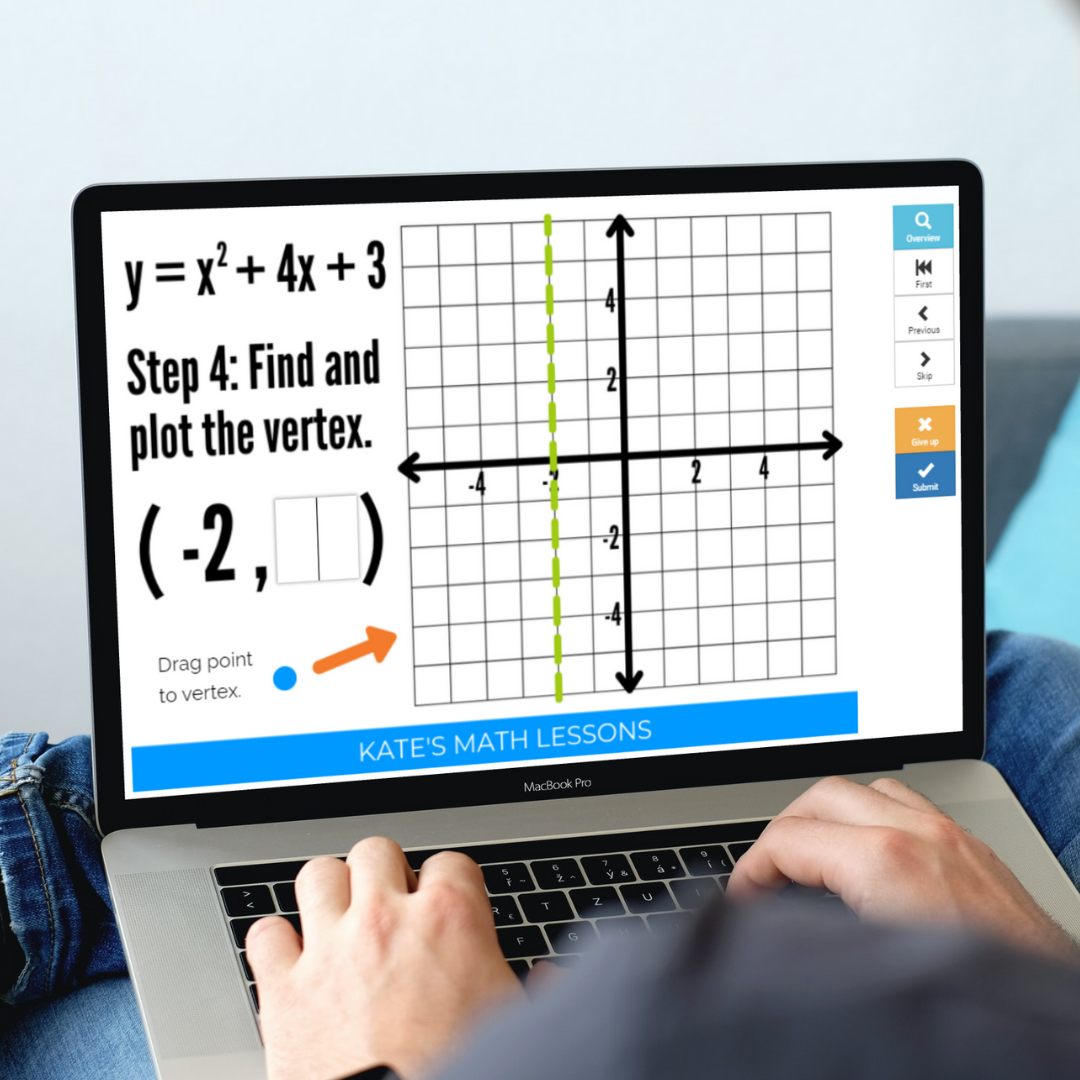 |
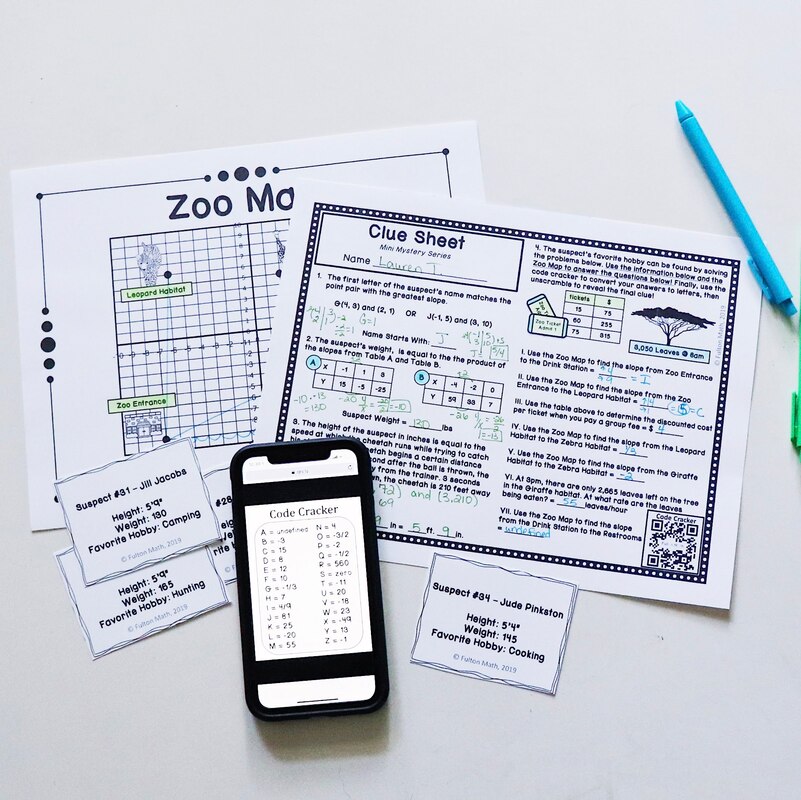 | MINI MYSTERIES from Lauren Fulton –Who doesn’t love a good mystery? With Mini Mysteries, students use standards-based math problems to solve murder mysteries! Each mystery comes with a mystery story, clue sheet (AKA, math problems that don’t feel like math problems), and a class set of suspect cards. As students work their way through the clue sheet, they narrow down the suspect list to find the guilty suspect! Print & digital versions come in each set. |
| OLD MATH GUY from Free to Discover - Engage your math students in interactive matching activities TWO different ways! Students play Old Math Guy (think Old Maid) in small groups. “Matches” are mathematical matches between 2 cards (ie 2(x+4) and 2x+8). Need a digital solution? The same cards can be used to complete an individual drag-n-drop practice activity in Google Slides. |  |
 | PRINT AND DIGITAL MATH PUZZLES from Scaffolded Math and Science – Each set of math puzzles comes in both print and digital form. The digital versions are drag-and-drop in GOOGLE Slides. The puzzles make for engaging classwork, station activities, partner work and review. |
We hope these print and digital resources help you teach in-person and virtual!

Okay, admittedly, I knew next to nothing about cryptocurrency, besides that it existed, until this year. More and more of my friends and family have been interested in and investing in crypto. It got me very curious about what it is and why are people buying it. As I dove more into it, I realized that the trend of several cryptocurrencies would be perfect for an exponential regression project. And quite frankly, digital currency is VERY exciting, as this isn’t something we’ve experienced ever before in history. It’s a brand new type of currency!
In this project, students will take a closer look at the price change of cryptocurrency and where it is potentially headed in the future via historical data and finding an exponential equation of best fit.
What is cryptocurrency? I’m sure you’re thinking that if you don’t know anything (or much) about cryptocurrencies that you can’t use this project with your students. WRONG. I’ve included a “Cryptocurrency: What is it?” introduction activity. This will help give the students (and you) enough basics about cryptocurrency in order to complete the project.
CRYPTOCURRENCY: BITCOIN AND BEYOND
OBJECTIVE
Students are to find the curve of best fit for a exponential function in the real world by performing the following:
- Understand the basics of cryptocurrency
- Research a cryptocurrency
- Gather accurate data and create a table
- Graph a scatter plot
- Find an exponential equation of best fit
- Graph an equation
- Predict future values of cryptocurrency using the equation of best fit
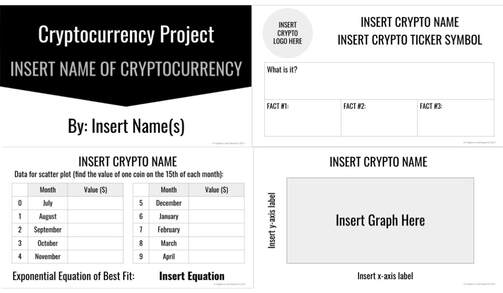
Students are given a specific cryptocurrency to research. The research includes finding the ticker symbol, learning what their currency is, three facts about their cryptocurrency, and collecting pricing data for their currency over a specific time period.
GRAPHING & RESULTS
Students use the TI-84 graphing calculator to find the exponential regression equation. Then they use Desmos to create a scatter plot and graph the exponential regression equation. Students answer questions to help them understand and analyze their results, including future price predictions for their cryptocurrency.
VISUALS
A Google Slides template is provided, so students can type in their information in the specific location. They then can easily turn their project into you via Google Classroom or email.
GRADING
An answer key that gives the data, equation of best fit, and the answers to the questions is included for each cryptocurrency. A rubric is provided, so you can easily evaluate each aspect of the project. It is great for students to use, so they know exactly what is expected of them.
| What’s included in the project?
EVERYTHING included in this project is 100% editable! So, you can adjust to fit your curriculum needs. | 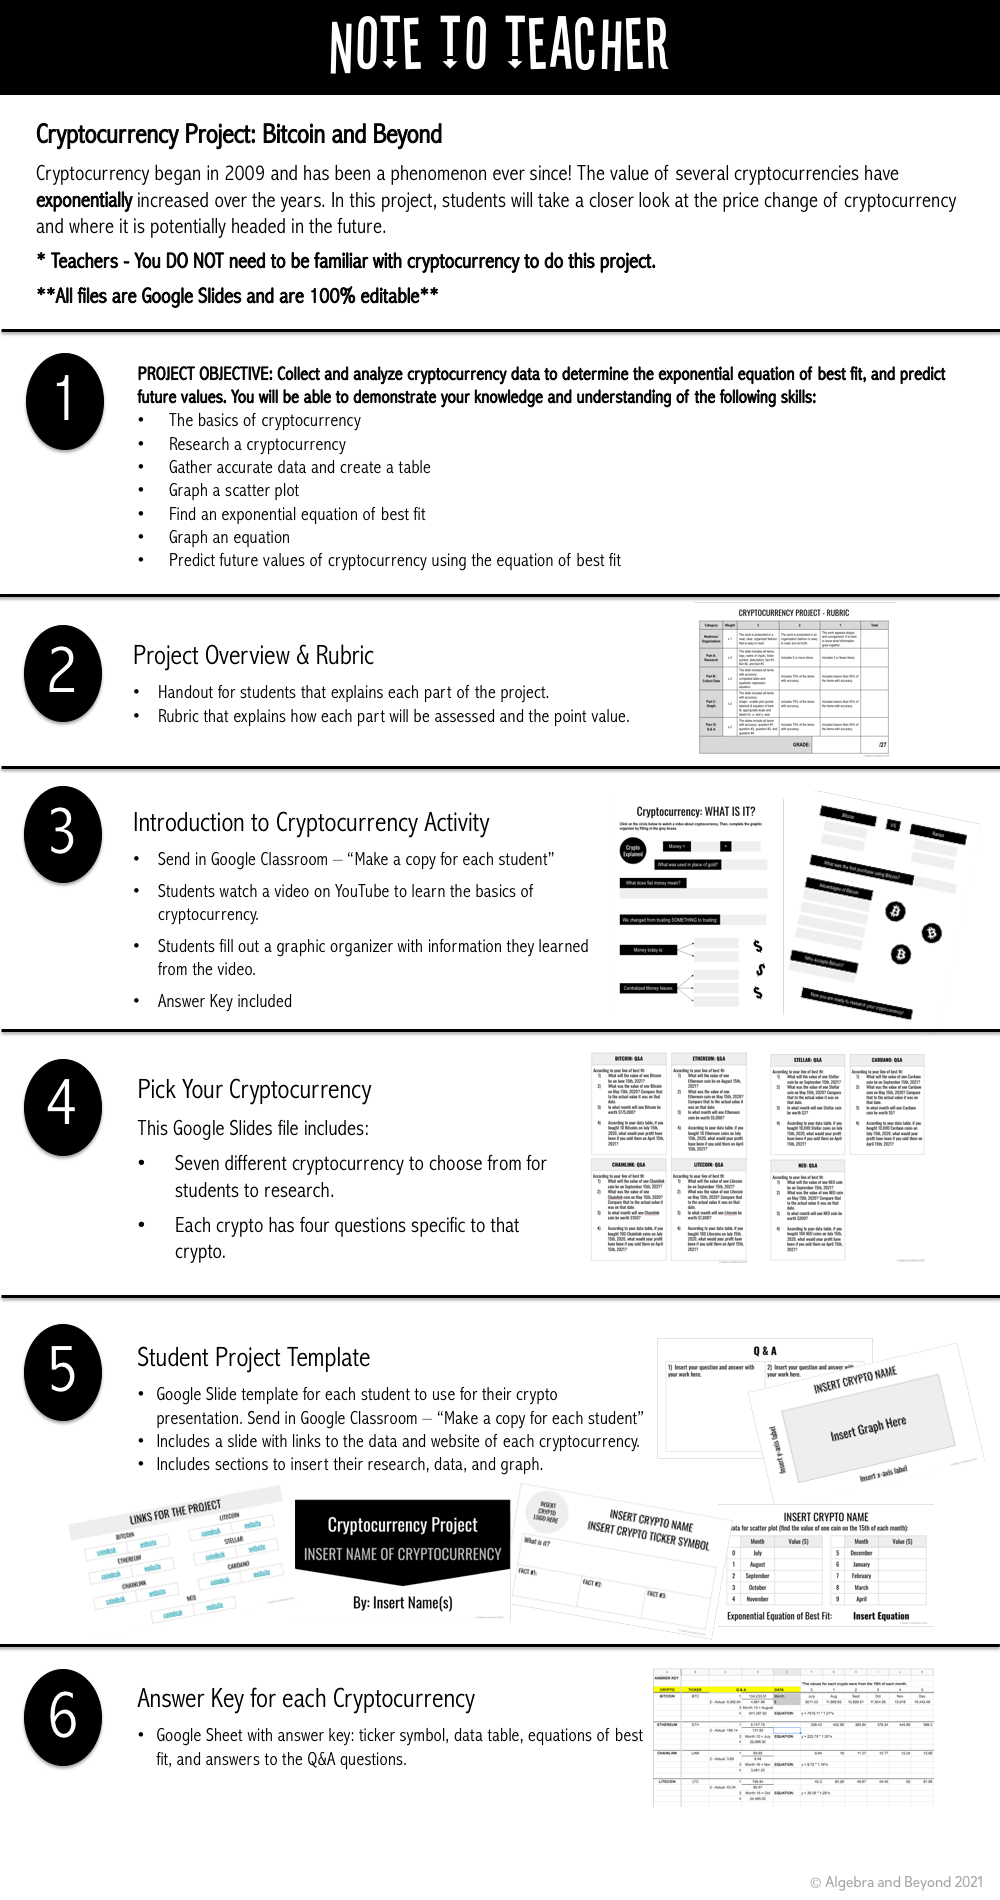 |
Click on the cover below to go directly to this project:
More mathtastic real world projects for your students:
 |  |  |

Hello there,
I'm TYRA!
I'm an educational blogger and curriculum designer. I am enthusiastic about providing creative, comprehensive, and clear resources for middle and high school math teachers. My goal is to create content that is easy to implement for the teacher, and helps students Connect Knowledge with Understanding - One Lesson at a Time.
Looking for something specific?
FIND ME HERE


Categories
All
Favorite Classroom Things
Free Stuff
Graphing Calculator
Math Activities
Math Projects
Math Warm Ups
Real World Math
Teacher Tips
Archives
July 2024
April 2024
January 2024
December 2023
October 2023
April 2023
February 2023
January 2023
November 2022
September 2022
June 2022
April 2022
February 2022
January 2022
September 2021
May 2021
October 2020
August 2020
June 2020
January 2020
November 2019
August 2019
February 2019
November 2018
October 2018
September 2018
April 2018
March 2018
February 2018
January 2018
December 2017
November 2017
September 2017
August 2017
May 2017
April 2017
March 2017
February 2017
January 2017
December 2016
 RSS Feed
FOLLOW ME
RESOURCES