ALGEBRA AND BEYOND
  • Home
  • Blog
  • Resources
    • Types of Resources
    • Resource Library Information
    • Resource Library - Members Area
  • Shop
  • Subscribe
  • About
  • Instructional Videos

CONNECTING KNOWLEDGE
with UNDERSTANDING 
{ONE LESSON AT A TIME}

MATH JUST GOT REAL: SYSTEMS OF LINEAR EQUATIONS PROJECT

8/26/2019

2 Comments

 
A real world project comparing different growth rates of trees. Students analyze linear systems of equations and graph.Pin it
​I am always trying to create or find projects where each student’s project will be different than every other student’s in the class because it is more authentic this way. And of course, I want it to be applicable in the real world! This is not always easy to make because if every student’s project is different, or even has an unlimited number of solutions, checking each one is extremely difficult and time-consuming for the teacher. Well, guess what?!...the project I’m about to tell you about is authentic AND I was able figure out how each student could have a different solution. And at the same time, have an answer key for the teacher with all the possible solutions….I know, fabulous, right!! And it covers one of the most popular math topics…Linear Systems of Equations!

Oh wait, one more cool thing about it….it’s not quite STEM because there isn’t any engineering, but I’d say it’s STAM (Science, Technology, Art, and Math)…fun little twist…so check it out:

Picture

OBJECTIVE

Every project needs to have a focus and goal. In this project, students are to…
  • Research the growth of a tree and write an equation to represent the growth
  • Determine when two trees will be the same height (algebraically & graphically)
  • Analyze the results
  • Create visuals to represent information about their tree and data results

RESEARCH & SOLUTIONS

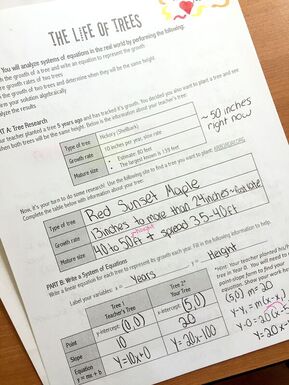
​Students select a tree from the Arbor Day site and find the growth rate range and mature size. Students write two equations – 1 to represent their tree’s growth over time and 2 - their teacher’s tree growth over time. Students use the substitution or elimination method to solve the system and explain the solution. Included is a spreadsheet where the teacher can record the student name, tree, and growth rate to ensure each student has a different growth rate.

VISUALS

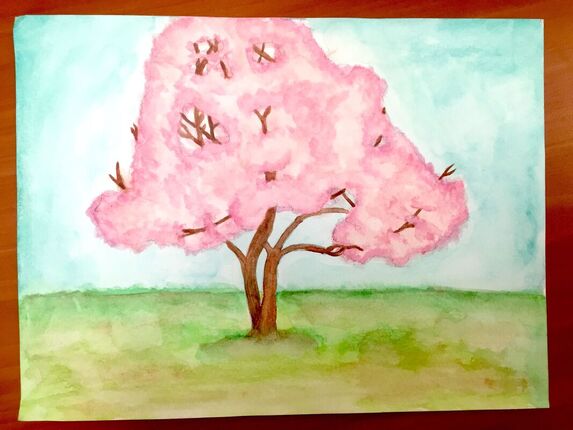
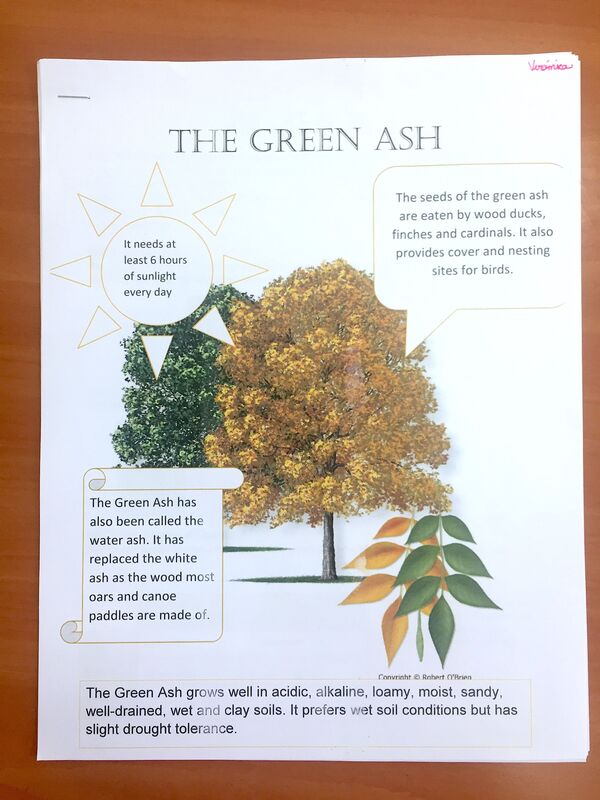
Student’s us graph paper or Desmos to re-create their system of linear equations by graphing both lines. Students also draw, paint, or find a picture of their tree online and label it by finding specific characteristics of their tree. I learn a lot of neat things about different trees from each project. And students love the artsy aspect!

RESULTS

Students find at what year the trees are the same height and determine if it’s realistic based on the year each tree will reach their mature size. This helps students understand that not every solution in the real world will make sense, so it’s important to critically think about the results.

GRADING

​As with any project, I do use a rubric, which is 100% editable for teachers. This project is evaluated on the following criteria: neatness/organization, accurate research, writing a systems of equations and finding the correct solution, the graph, analyzing the results, and the visuals. I also include an answer key for the questions and all of the possible scenarios/solutions depending on the growth rate of each tree in comparison with the growth rate of the teacher’s tree. This is a HUGE time saver for teachers!

This project is very dynamic, creative, and fun! Here are some of my student’s Life of Trees Projects: 

Students analyze systems of linear equations in the real world by comparing growth rates of trees.
Picture
Picture
Students analyze systems of linear equations in the real world by comparing growth rates of trees.

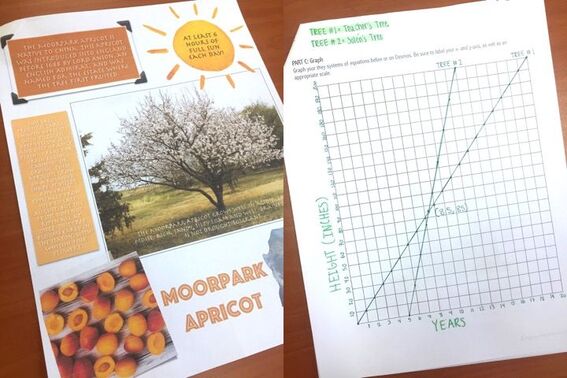
Click on the Life of Trees Project cover below to go directly to the resource. Look at the preview to learn even more about this activity!

Students analyze systems of linear equations in the real world by comparing growth rates of trees.

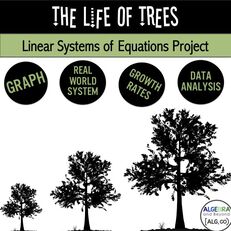
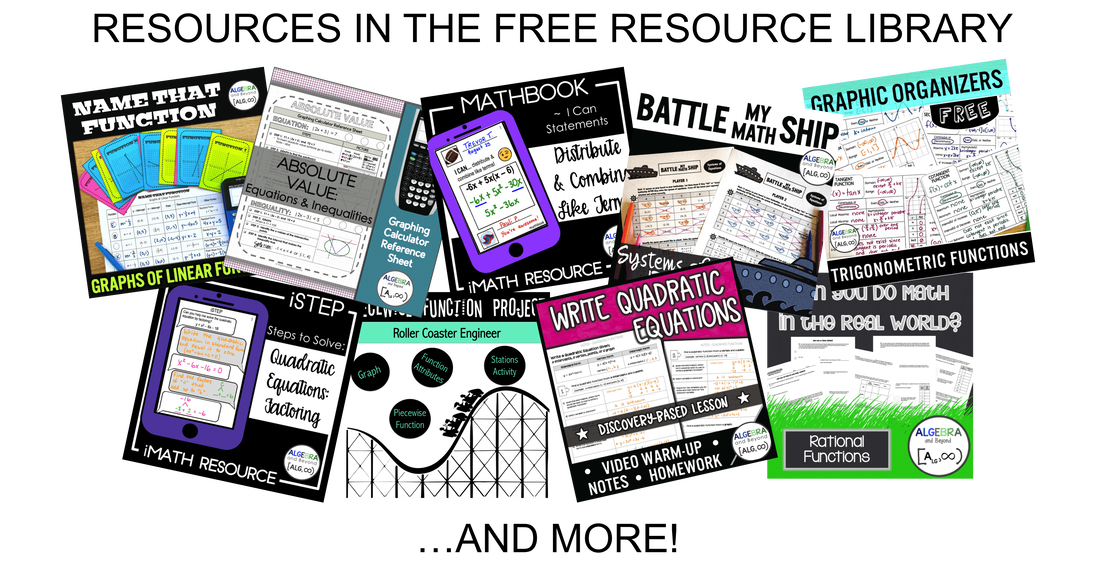
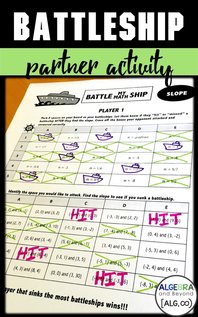
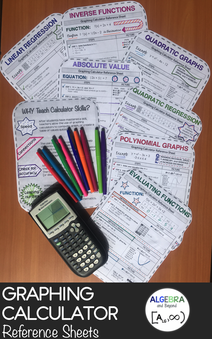
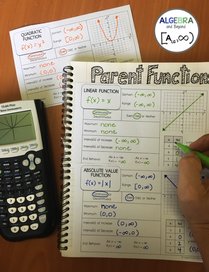
​Here are more resources for systems of equations:

Picture
Picture
Picture
Picture

Want to join the Algebra and Beyond mailing list to have instant access to fun and engaging resources?!

YES! Sounds awesome!!!
Pin it
2 Comments
    Picture

    Hello there,
    ​I'm TYRA!

    I'm an educational blogger and curriculum designer. I am enthusiastic about providing creative, comprehensive, and clear resources for middle and high school math teachers. My goal is to create content that is easy to implement for the teacher, and helps students Connect Knowledge with Understanding - One Lesson at a Time.


    Looking for something specific?


    FIND ME HERE


    Categories

    All
    Favorite Classroom Things
    Free Stuff
    Graphing Calculator
    Math Activities
    Math Projects
    Math Warm Ups
    Real World Math
    Teacher Tips

    Archives

    September 2024
    July 2024
    April 2024
    January 2024
    December 2023
    October 2023
    April 2023
    February 2023
    January 2023
    November 2022
    September 2022
    June 2022
    April 2022
    February 2022
    January 2022
    September 2021
    May 2021
    October 2020
    August 2020
    June 2020
    January 2020
    November 2019
    August 2019
    February 2019
    November 2018
    October 2018
    September 2018
    April 2018
    March 2018
    February 2018
    January 2018
    December 2017
    November 2017
    September 2017
    August 2017
    May 2017
    April 2017
    March 2017
    February 2017
    January 2017
    December 2016

    RSS Feed


    FOLLOW ME

    Picture

    RESOURCES


    Subscribe to Algebra and Beyond
    Want to discover new ideas, receive updates, and gain INSTANT ACCESS to the Algebra and Beyond Resource Library with over 25 free resources?!?!
    Picture
    Picture
    Students battle using their math skills to attack their opponents ships. Correct space and solution = a sunken ship. Algebra fun at it's best!

    TEACHER: And that is how you find the MIN/MAX on your calculator. *BOOM* Drop the mic! STUDENT: What do I put in Y1? _ _ _ _ _ _ _ _ _ No more of this! Give your students a great reference sheet to put in their notebook and NEVER ask you the keystrokes again!
    Parent Function Graphic Organizers - domain, range, continuity, intervals of increase/decrease, min/max, end behavior, intercepts, and the graph
    Graphic Organizer: domain, range, intercepts, asymptotes, intervals of inc/decrease, max/min, and end behavior.
    Students will create a roller coaster that demonstrates their knowledge and understanding of the following skills: • Graph a continuous function that represents a roller coaster using parent functions. • Write a piecewise-defined function to represent the entire roller coaster. • Attributes of functions: Domain/Range, Min/Max, and Intervals of Inc/Dec
COPYRIGHT ALGEBRA AND BEYOND 2016-2025
  • Home
  • Blog
  • Resources
    • Types of Resources
    • Resource Library Information
    • Resource Library - Members Area
  • Shop
  • Subscribe
  • About
  • Instructional Videos