ALGEBRA AND BEYOND
  • Home
  • Blog
  • Resources
    • Types of Resources
    • Resource Library Information
    • Resource Library - Members Area
  • Shop
  • Subscribe
  • About
  • Distance Learning
    • Ideas & Tips
    • Instructional Videos

CONNECTING KNOWLEDGE
with UNDERSTANDING 
{ONE LESSON AT A TIME}

MATH JUST GOT REAL: QUADRATIC REGRESSION PROJECT

6/24/2020

0 Comments

 
Quadratic Regression Real World Project Blog PostPin it
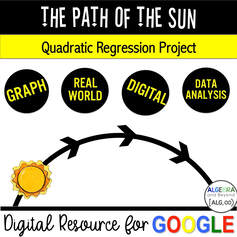
Using data to find a quadratic graph of best fit is an awesome way to connect math with the real world. However, it’s not always easy to find authentic data to use for a quadratic regression equation. I REALLY wanted to use the flight of a soccer ball or golf ball and find a video on YouTube that had all the stats using a trace finder that states the distance and height. I searched and searched, but could not find a video that was clear and had the information needed to collect data for a scatter plot. So, I began looking at weather patterns, but that wasn’t quite right either. However, it helped me stumble across the timeanddate.com site. This is when I realized I can use the time of day and the altitude of the sun for a quadratic regression real world project! Of course, you can only use it for ONE day otherwise, it’s a periodic function. Here are the details of the project...

Picture


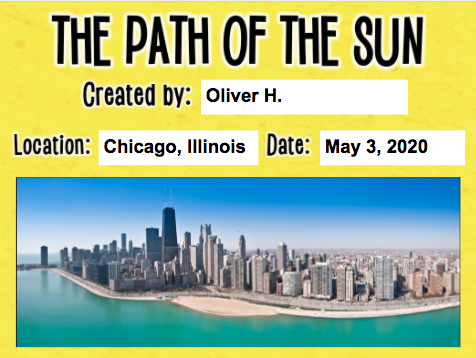
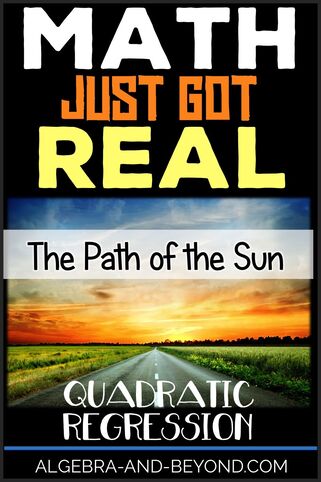
​THE PATH OF THE SUN
​

Picture
OBJECTIVE
In this project, students are to find the curve of best fit for a quadratic function in the real world by performing the following:
  • Choose a city, country and date for your research.
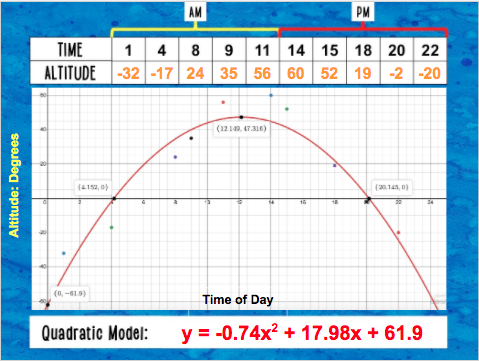
  • Collect data on the relationship between time of day and the altitude of the sun.
  • Record your information in a table.
  • Find the curve of best-fit model using the quadratic regression feature on a graphing calculator.
  • Graph the scatter plot of the data set and the curve of best fit in Desmos.
  • Analyze the results.
  • Record all of the information in a Google Slide Presentation.​

​REASEARCH

Students choose a location (city, state/country) and a specific date to use to collect their data. They use the timeanddate.com site to find the altitude of the sun at specific times of the day.
Picture
Quadratic scatter plot and equation on Desmos
RESULTS
Students use the TI-84 graphing calculator to find the quadratic regression equation. Then they use Desmos to create a scatter plot and graph the quadratic regression equation. Students answer questions to help them understand and analyze their results.

​VISUALS

The Google Slides template is provided, so students can type in their information in the specific location. They then can easily turn their project into you via Google Classroom or email.

​
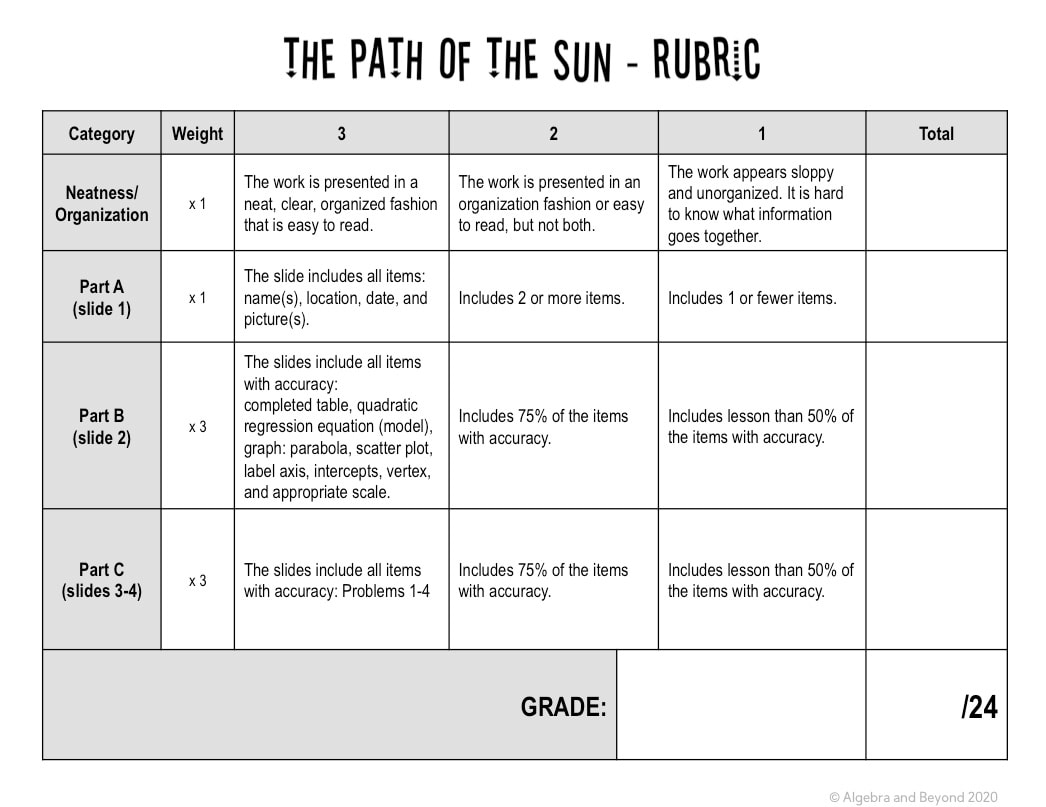
​GRADING

A rubric is provided, so you can easily evaluate each aspect of the project. It is great for students to use, so they know exactly what is expected of them.
Picture
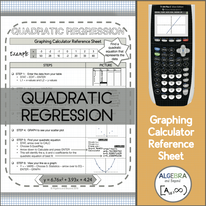
Quadratic Regression TI-84 Calculator Guide
​Included:
  • Note to Teacher
  • Project Directions
  • Student Template (Google Slides)
  • Example Project (Google Slides)
  • Rubric
  • Spreadsheet for students to choose a location
  • BONUS: Quadratic Regression Calculator Sheet - shows students step by step on how to find the quadratic regression equation
The project directions and rubric are 100% editable! This is very easy to integrate into any Algebra course either in-person or online, gives students some freedom of what place to research, and is mathtastically fun! And since it’s editable, you can even change it to record data over several days and find the sinusoidal regression equation for a higher-level math course.
 
Click on the cover below to go directly to this project:
Quadratic Regression Real World Project
Other projects you may like:
Math Review Project
Linear Equations Real World Project
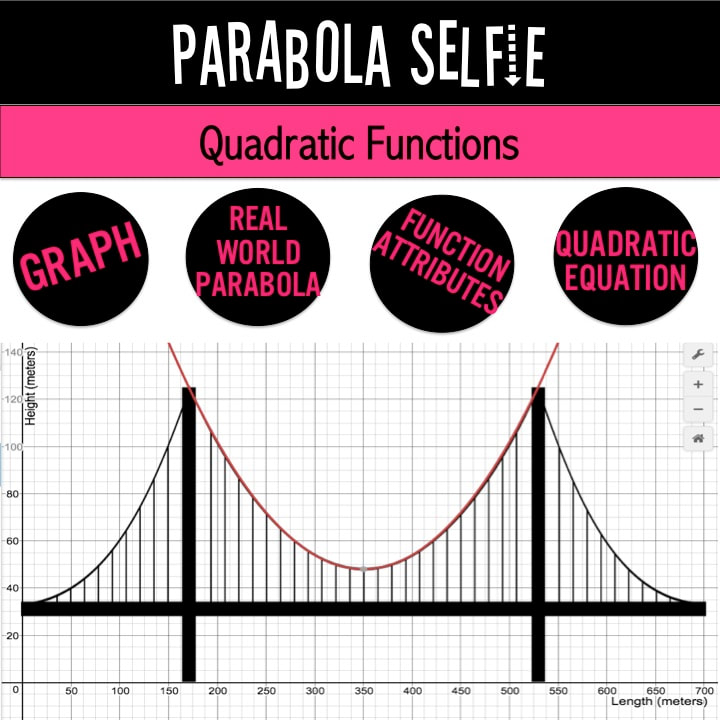
Quadratics Real World Project
Linear and Exponential Regression Real World Project
Absolute Value Inequalities Real World Project
Linear Systems of Equations Project
Don't forget to join the Algebra and Beyond Community!
ENTER HERE
Pin it
0 Comments


Leave a Reply.

    Picture

    Hello there,
    ​I'm TYRA!

    I'm an educational blogger and curriculum designer. I am enthusiastic about providing creative, comprehensive, and clear resources for middle and high school math teachers. My goal is to create content that is easy to implement for the teacher, and helps students Connect Knowledge with Understanding - One Lesson at a Time.


    Looking for something specific?


    FIND ME HERE


    Categories

    All
    Favorite Classroom Things
    Free Stuff
    Graphing Calculator
    Math Activities
    Math Projects
    Math Warm Ups
    Real World Math
    Teacher Tips

    Archives

    February 2023
    January 2023
    November 2022
    September 2022
    June 2022
    April 2022
    February 2022
    January 2022
    September 2021
    May 2021
    October 2020
    August 2020
    June 2020
    January 2020
    November 2019
    August 2019
    February 2019
    November 2018
    October 2018
    September 2018
    April 2018
    March 2018
    February 2018
    January 2018
    December 2017
    November 2017
    September 2017
    August 2017
    May 2017
    April 2017
    March 2017
    February 2017
    January 2017
    December 2016

    RSS Feed


    FOLLOW ME

    Picture

    RESOURCES


    Subscribe to Algebra and Beyond
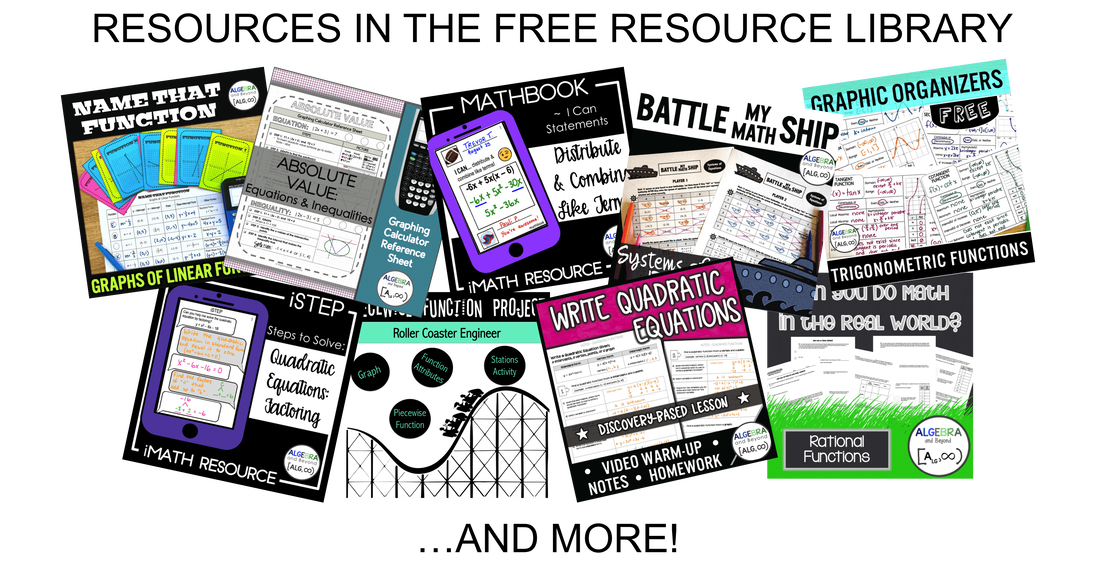
    Want to discover new ideas, receive updates, and gain INSTANT ACCESS to the Algebra and Beyond Resource Library with over 25 free resources?!?!
    Picture
    Picture
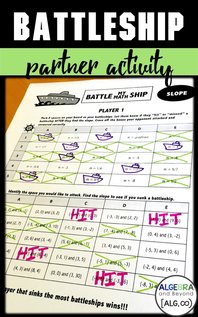
    Students battle using their math skills to attack their opponents ships. Correct space and solution = a sunken ship. Algebra fun at it's best!

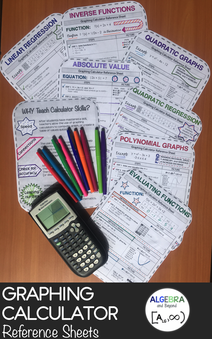
    TEACHER: And that is how you find the MIN/MAX on your calculator. *BOOM* Drop the mic! STUDENT: What do I put in Y1? _ _ _ _ _ _ _ _ _ No more of this! Give your students a great reference sheet to put in their notebook and NEVER ask you the keystrokes again!
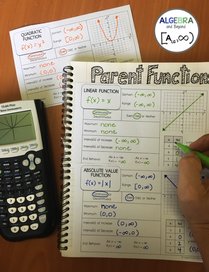
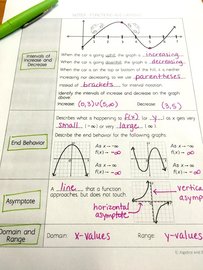
    Parent Function Graphic Organizers - domain, range, continuity, intervals of increase/decrease, min/max, end behavior, intercepts, and the graph
    Graphic Organizer: domain, range, intercepts, asymptotes, intervals of inc/decrease, max/min, and end behavior.
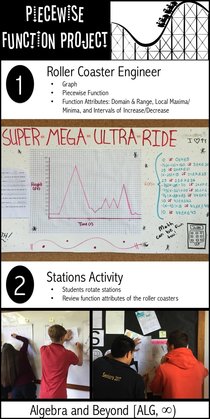
    Students will create a roller coaster that demonstrates their knowledge and understanding of the following skills: • Graph a continuous function that represents a roller coaster using parent functions. • Write a piecewise-defined function to represent the entire roller coaster. • Attributes of functions: Domain/Range, Min/Max, and Intervals of Inc/Dec
COPYRIGHT ALGEBRA AND BEYOND 2016-2023
  • Home
  • Blog
  • Resources
    • Types of Resources
    • Resource Library Information
    • Resource Library - Members Area
  • Shop
  • Subscribe
  • About
  • Distance Learning
    • Ideas & Tips
    • Instructional Videos