ALGEBRA AND BEYOND
  • Home
  • Blog
  • Resources
    • Types of Resources
    • Resource Library Information
    • Resource Library - Members Area
  • Shop
  • Subscribe
  • About
  • Instructional Videos

CONNECTING KNOWLEDGE
with UNDERSTANDING 
{ONE LESSON AT A TIME}

LINEAR AND EXPONENTIAL REGRESSION PROJECT - THE COLLEGE TREND

4/18/2017

3 Comments

 
College Trend Project - Compare exponential and linear regression lines based on college tuition trends. Includes a self-check stations activity! All 100% editable.Pin it
It’s that time of year when seniors are receiving their college acceptance letters. Woohoo, so exciting! The school where I work is very small, so we acknowledge each acceptance for every senior at monthly assemblies. It’s so neat to hear all the different schools that our students have been accepted! Often I get a little teary-eyed because I am so proud of them.
 
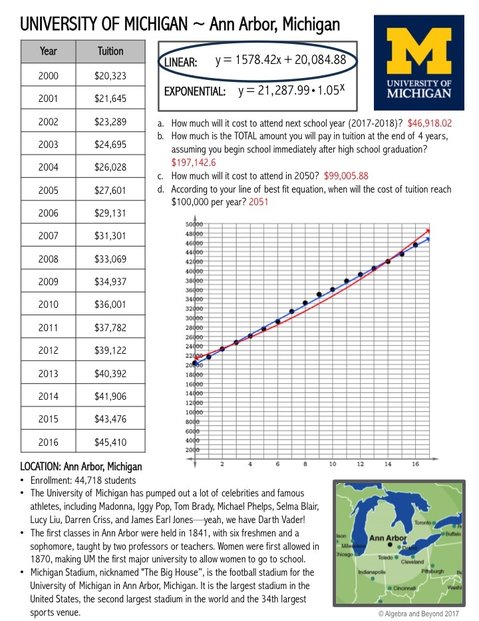
This makes it a perfect time for me to whip out the College Trend Project involving linear and exponential lines of best fit. Students research different universities to see if the tuition is trending as a linear or exponential function and predict future tuition costs.

So, if you are looking for a "real world" project that is engaging and meaningful, look no further!

Engaging and meaningful real world algebra project on linear and exponential lines of best fit. Students analyze college tuition trend lines.Pin it
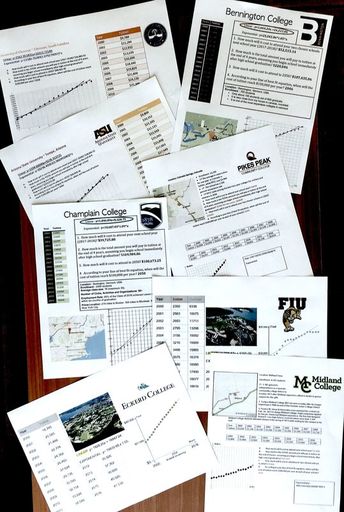
Students will be able to demonstrate their knowledge and understanding of the following skills:
  • Gather accurate data and create a table
  • Graph a scatter plot
  • Find the linear and exponential line of best fit and graph
  • Determine which equation (linear or exponential) best models the data
  • Predict future tuition costs using the line of best fit function
  • Research background information about each university/college  

​Of all the projects we do, this is definitely my students’ favorite. They LOVE to research universities they are interested in attending and are shocked by how much the cost has changed over the years. I also incorporate a stations activity, so students can review each other’s projects. The students have fun looking at other universities they may not have thought of or even heard of before. Plus, these student sheets help you grade the projects too, which is a nice perk!
 
Most students do this project in 9th or 10th grade, so by the time they are seniors, we love to look back and talk about the schools they thought they would attend and how their plans may have changed.
 
If you are interested in learning more about this project and using it in your class, click on the example below. The project and rubric are 100% editable, so you can adjust the years. Plus, I’ve included two bonus calculator reference sheets (linear regression and exponential regression) to help your students with the line of best fit portion of the project. Oh, and I forgot to mention there is a ton of technology integrated into this project!

Picture
Example of college tuition trend project. Students analyze and determine - linear or exponential line of best fit?
Pin it

​For more teaching ideas and instant access to the Algebra and Beyond Resource Library, join the the mailing list!
Yes, sign me up!
Pin it
3 Comments
shiva link
6/4/2021 04:38:19 am

Thank you, for this information
The blog is very informative. looking forward to reading more from you thank you
<a href="https://sactuitions.in/blogs/b-tech-tuitions-in-dilsukhnagar/">b.tech tuitions</a>


Reply
Almost Void link
7/10/2023 06:14:01 pm

Thanks great blog postt

Reply
Sr. Mary Teresa
12/29/2023 08:10:45 am

We are doing a math fair in the spring for high school students. I am interested in many of your ideas as they are excellent. I hesitate to download for now - do you sell any books with your ideas?
Thank You.
Sr. Mary Teresa and Sr. Mary Euphrasia

Reply


Leave a Reply.

    Picture

    Hello there,
    ​I'm TYRA!

    I'm an educational blogger and curriculum designer. I am enthusiastic about providing creative, comprehensive, and clear resources for middle and high school math teachers. My goal is to create content that is easy to implement for the teacher, and helps students Connect Knowledge with Understanding - One Lesson at a Time.


    Looking for something specific?


    FIND ME HERE


    Categories

    All
    Favorite Classroom Things
    Free Stuff
    Graphing Calculator
    Math Activities
    Math Projects
    Math Warm Ups
    Real World Math
    Teacher Tips

    Archives

    September 2024
    July 2024
    April 2024
    January 2024
    December 2023
    October 2023
    April 2023
    February 2023
    January 2023
    November 2022
    September 2022
    June 2022
    April 2022
    February 2022
    January 2022
    September 2021
    May 2021
    October 2020
    August 2020
    June 2020
    January 2020
    November 2019
    August 2019
    February 2019
    November 2018
    October 2018
    September 2018
    April 2018
    March 2018
    February 2018
    January 2018
    December 2017
    November 2017
    September 2017
    August 2017
    May 2017
    April 2017
    March 2017
    February 2017
    January 2017
    December 2016

    RSS Feed


    FOLLOW ME

    Picture

    RESOURCES


    Subscribe to Algebra and Beyond
    Want to discover new ideas, receive updates, and gain INSTANT ACCESS to the Algebra and Beyond Resource Library with over 25 free resources?!?!
    Picture
    Picture
    Students battle using their math skills to attack their opponents ships. Correct space and solution = a sunken ship. Algebra fun at it's best!

    TEACHER: And that is how you find the MIN/MAX on your calculator. *BOOM* Drop the mic! STUDENT: What do I put in Y1? _ _ _ _ _ _ _ _ _ No more of this! Give your students a great reference sheet to put in their notebook and NEVER ask you the keystrokes again!
    Parent Function Graphic Organizers - domain, range, continuity, intervals of increase/decrease, min/max, end behavior, intercepts, and the graph
    Graphic Organizer: domain, range, intercepts, asymptotes, intervals of inc/decrease, max/min, and end behavior.
    Students will create a roller coaster that demonstrates their knowledge and understanding of the following skills: • Graph a continuous function that represents a roller coaster using parent functions. • Write a piecewise-defined function to represent the entire roller coaster. • Attributes of functions: Domain/Range, Min/Max, and Intervals of Inc/Dec
COPYRIGHT ALGEBRA AND BEYOND 2016-2025
  • Home
  • Blog
  • Resources
    • Types of Resources
    • Resource Library Information
    • Resource Library - Members Area
  • Shop
  • Subscribe
  • About
  • Instructional Videos